Lecture
Content
The statistical summary is the following, after statistical observation, the step of statistical work. Its task is to bring the collected information and materials in a certain order, systematize and, on this basis, give a consolidated description of the entire population studied.
Statistical summary - a set of sequential operations for the primary processing of data in order to identify typical features and patterns inherent in the phenomenon under study. This is a scientifically-organized processing of observation materials, including the calculation of group and total totals, systematization, grouping of data and tabulation.
Types of summaries
There are simple and complex summary:
The summary is called decentralized if the unified management of work is carried out from the center, and the immediate work is carried out in the field (usually used when processing statistical reports).
If the collection and processing of data is carried out in one place, then the report is called centralized . A centralized summary is usually used to process materials from one-time statistical surveys.
The statistical reporting and grouping is preceded by the development of a statistical observation program consisting of several stages: the choice of a grouping attribute, the development of a system of statistical indicators.
Statistical summary should be carried out according to a specific program and plan.
The summary consists of the following steps:
Most often, simple summary summaries do not satisfy the researcher, since they give too general ideas about the phenomenon being studied. Therefore, statistical material is subject to grouping.
Grouping is a method in which the entire study population is divided into groups according to some essential feature. For example, the grouping of enterprises by type of ownership or the grouping of the population by the size of per capita income.
The grouping provides the basis for subsequent summary and data analysis.
The third stage of statistical research is that with the help of generalizing generalizing statistical indicators: relative and average values, indicators of variation and dynamics, economic indices, as well as using tabular and graphical methods, the obtained data is analyzed.
Grouping statistics
Grouping is a method in which the entire studied population is divided into groups according to some essential feature.
The sign on which the grouping is carried out is called a grouping sign or the basis of the grouping.
Grouping is a method of subdividing the considered set of data into groups that are homogeneous according to the characteristics being studied. This is done in order to study the structure of this aggregate or the relationships between the individual elements of this aggregate. Using grouping, you can identify the effect of individual units on average totals. For example, the grouping of workers in a given organization according to the level of labor productivity is used to identify the effect of high labor productivity of individual workers on the average productivity of the organization and to determine the reserve, which lies in increasing the labor productivity of all workers to the level of advanced workers.
As will be shown in the articles of this site, the most common in economic analysis is grouping by factors related to:
These three groups of factors influence the volume of products manufactured by this organization.
Types of groupings
The choice of the grouping attribute depends on the purpose of the grouping and the preliminary economic analysis of the phenomenon.
Depending on the degree of complexity of the mass phenomenon and the tasks of analysis - groups can be made on one or several grounds:
Depending on the tasks to be solved, there are typological, structural and analytical groups:
In the process of conducting economic analysis, as a rule, two main types of groupings are used: structural and analytical .
Structural groupings are used to study the composition and structure of the totality of data, as well as to study the changes in this set that take place in accordance with the selected changing feature.
Analytical grouping is used to study the mutual relationships that exist between the indicators characterizing the considered set of data. Under these conditions, one of the indicators is generalizing, productive, and other indicators are considered as factors affecting the generalizing indicator.
1. The choice of grouping feature
Depending on the type of grouping characteristics, groups are distinguished according to quantitative and qualitative (attributive) characteristics.
2. Determination of the number of groups:
If at the basis of the grouping there is an attribute (quality) attribute, then the number of groups is equal to the number of values of this attribute.
If the basis of the grouping is a quantitative trait, then the number of groups is determined by the Sturgess formula :

 - number of groups
 - the number of units in the population
We get the following relationship:
|
15-24 | 25-44 | 45-89 | 90-179 | 180-359 | 360-719 |
|
five | 6 | 7 | eight | 9 | ten |
3. Select grouping interval:
The grouping interval is the value of a varying attribute that lies within certain limits. The lower limit of the interval is the value of the smallest attribute in the interval. The upper limit is the largest value in the interval.
The interval is the difference between the upper and lower bounds.
Intervals of groupings can be equal and unequal.
Equal intervals are used in cases where the value of a quantitative trait within a population varies uniformly.
The value of equal intervals is determined by the formula:
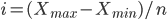
 - interval value
 - the maximum value of the trait in the aggregate
 - the minimum value of the trait in the aggregate - number of groups
Interval rounding rules:
Intervals are open and closed. Closed is an interval in which there are both lower and upper bounds, otherwise the interval is considered open. When solving problems, the unknown boundary of the open interval is determined by the size of the interval adjacent to it.
Classification
From the groupings should be distinguished classification. Classification is the basis of groupings.
Classification refers to the systematic distribution of phenomena and objects into specific groups, classes, and discharges based on their similarities and differences. A distinctive feature of the classification is that it is based on a qualitative sign .
An example . Distribution of enterprises in the region by the value of retail turnover in the current year.
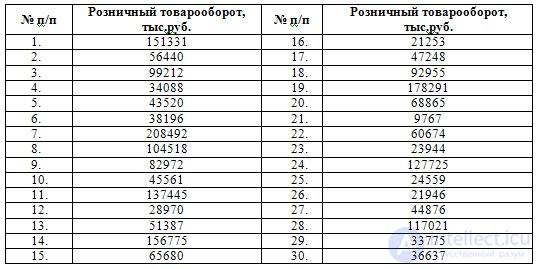
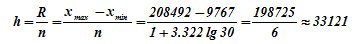
If the number of groups is not specified in advance then to determine the number of groups, you can use the Sturgess formula:
Where - The number of units in the population.
The interval is determined by the following formula:
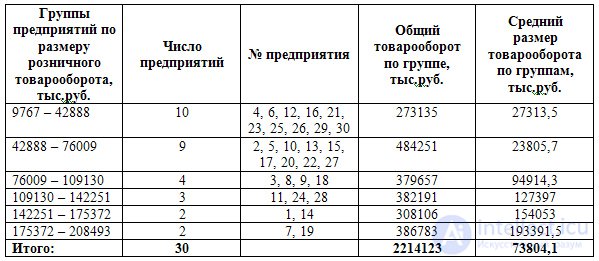
The results will be presented in tabular form.
In practice, it is sometimes necessary to use the already existing groupings, which may be incomparable due to the unequal limits of the intervals or the different number of groups allocated. To bring such groups to a comparable form, the method of secondary grouping is used.
Secondary grouping is the formation of new groups based on the previously produced grouping.
In the secondary grouping, two methods are used to form new groups:
Example 1
There is a grouping of employees of two departments of one of the banks according to the size of the monthly salary.
|
Group number |
Currency management |
Credit management |
||
|
Salary thousand roubles. |
Number of employees Cove, people |
Salary thousand roubles. |
Number of employees, people |
|
|
one |
to 10 |
five |
up to 15 |
2 |
|
2 |
10-30 |
20 |
15-20 |
five |
|
3 |
30-50 |
60 |
20-30 |
ten |
|
four |
50-100 |
180 |
30-40 |
35 |
|
five |
100-150 |
40 |
40-50 |
100 |
|
6 |
150 or more |
15 |
50-100 |
120 |
|
7 |
100-200 |
78 |
||
|
Total |
320 |
350 |
||
These groups of employees are incomparable, since in these groups there are different grouping intervals and a different number of educated groups.
We will produce a secondary grouping by the method of enlarging the intervals:
|
Group number |
Salary thousand roubles. |
Currency management |
Credit management |
||
|
Number of employees |
Number of employees |
||||
|
People |
In% to the total |
People |
In% to the total |
||
|
one |
up to 30 |
25 |
7.81 |
17 |
4.85 |
|
2 |
30-50 |
60 |
18.75 |
135 |
38.57 |
|
3 |
50-100 |
180 |
56.25 |
120 |
34.29 |
|
four |
100-150 |
55 |
17.19 |
78 |
22.29 |
|
Total |
320 |
100.00 |
350 |
100.00 |
|
In the case of secondary grouping using the method of share regrouping, we establish new intervals for the distribution of workers by the size of the monthly salary, while at each interval we fix a certain share of the aggregate units:
|
Group number |
Salary thousand roubles. |
Currency management |
Credit management |
||
|
Number of employees |
Number of employees |
||||
|
People |
In% to the total |
People |
In% to the total |
||
|
one |
up to 20 |
15 |
4.69 |
7 |
2.00 |
|
2 |
20-40 |
40 |
12.5 |
45 |
12.86 |
|
3 |
40-50 |
thirty |
9.37 |
100 |
28,57 |
|
four |
50-100 |
180 |
56.25 |
120 |
34.29 |
|
five |
100-150 |
40 |
12.50 |
39 |
11.14 |
|
6 |
150 or more |
15 |
4.69 |
39 |
11.14 |
|
Total |
320 |
100.00 |
350 |
100.00 |
|

Comments
To leave a comment
Probability theory. Mathematical Statistics and Stochastic Analysis
Terms: Probability theory. Mathematical Statistics and Stochastic Analysis