Lecture
Suppose we are studying some random variable  , the distribution law of which is exactly unknown, and it is required to determine this law from experience or experimentally test the hypothesis that the quantity subject to one or another law. To this end, over a random variable A number of independent experiments (observations) are carried out. In each of these experiments, the random variable takes a certain value. The aggregate of the observed values of the quantity is the primary statistical material to be processed, comprehended and scientifically analyzed. Such a set is called a “simple statistical set” or a “simple statistical series”. Usually a simple statistical aggregate is drawn up in the form of a table with one entry, in the first column of which is the number of experience
  , and in the second - the observed value of a random variable.
Example 1. Random variable  - the glide angle of the aircraft at the time of dropping the bomb (the glide angle implies the angle drawn up by the velocity vector and the plane of symmetry of the airplane). Produced 20 bombings, each of which recorded a slip angle in thousandths of radians. The results of the observations are summarized in a simple statistical series:
|
|
|
|
|
|
one 2 3 four five 6 7 | -20 -60 -ten thirty 60 70 -ten | eight 9 ten eleven 12 13 14 | -thirty 120 -100 -80 20 40 -60 | 15 sixteen 17 18 nineteen 20 | -ten 20 thirty -80 60 70 |
A simple statistical series is the primary form of recording statistical material and can be processed in various ways. One of the methods of such processing is the construction of a statistical distribution function of a random variable.
The statistical distribution function of a random variable called event frequency  in this statistical material:
 . (7.2.1)
In order to find the value of the statistical distribution function for a given  , it is enough to count the number of experiments in which the magnitude took a value less than and divide by total
  produced experiences.
Example 2. Construct a statistical distribution function for a random variable considered in the previous example.
Decision. Since the smallest observed value is  then
then  . Value observed once, its frequency is
  ; hence at
  has a jump equal to . In the interval from before
  function has the meaning ; at the point function jump occurs on
  as the value observed twice, etc.
The graph of the statistical distribution function of the magnitude is shown in Fig.7.2.1.
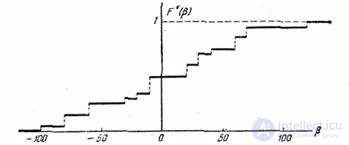
Fig. 7.2.1
The statistical distribution function of any random variable, continuous or continuous, is a discontinuous step function whose jumps correspond to the observed values of the random variable and are equal in magnitude to the frequencies of these values. If every single value of a random variable was observed only once, the jump in the statistical distribution function in each observed value is  where - the number of observations.
With an increase in the number of experiences , according to the Bernoulli theorem, for any event frequency approaches (converges in probability) to the probability of this event. Consequently, with increasing statistical distribution function  approaches (converges in probability) to the true distribution function
  random variable .
If a - continuous random variable, then with increasing number of observations the number of function jumps increases, most jumps decrease and the function graph unboundedly approaching a smooth curve - size distribution functions .
In principle, the construction of a statistical distribution function already solves the problem of describing experimental material. However, with a large number of experiments construction the above method is very time consuming. In addition, it is often convenient, in the sense of clarity, to use other characteristics of statistical distributions that are similar to non-distribution functions. , and density  . With such ways of describing statistical data we will get acquainted in the next paragraph.


Comments
To leave a comment
Probability theory. Mathematical Statistics and Stochastic Analysis
Terms: Probability theory. Mathematical Statistics and Stochastic Analysis