Lecture
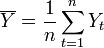
Correlation (from the Latin. Correlatio - correlation, interrelation), correlation dependence - the statistical interrelation of two or several random variables (or quantities that can be considered as such with some acceptable degree of accuracy). In this case, changes in the values of one or several of these quantities are accompanied by a systematic change in the values of another or other quantities. [1] The mathematical measure of the correlation of two random variables is the correlation ratio  [2] or correlation coefficient
  (or
(or  ) [1] . If a change in one random variable does not lead to a regular change in another random variable, but leads to a change in another statistical characteristic of this random variable, then this connection is not considered correlation, although it is statistical [3] .
For the first time, the term “correlation” was introduced by the French paleontologist Georges Cuvier in the 18th century. He developed the "law of correlation" of parts and organs of living beings, with which it is possible to restore the appearance of a fossil animal, having at its disposal only a part of its remains. In statistics, the word "correlation" was first used by the English biologist and statistician, Francis Galton, at the end of the 19th century. [four]
Some types of correlation coefficients may be positive or negative. In the first case, it is assumed that we can only determine the presence or absence of a connection, and in the second, also its direction. If it is assumed that a strict order relation is given on the values of variables, then a negative correlation is a correlation, at which an increase in one variable is associated with a decrease in another. In this case, the correlation coefficient will be negative. A positive correlation in such conditions is a relationship in which an increase in one variable is associated with an increase in another variable. It is also possible that there is no statistical relationship — for example, for independent random variables.
A significant correlation between two random variables is always evidence of the existence of a certain statistical relationship in a given sample, but this relationship does not necessarily have to be observed for another sample and have a causal effect. Often the tempting simplicity of a correlational study encourages the researcher to draw false intuitive conclusions about the presence of a causal relationship between pairs of signs, while the correlation coefficients establish only statistical relationships. For example, considering fires in a particular city, it is possible to reveal a very high correlation between the damage caused by the fire and the number of firefighters who participated in extinguishing the fire, and this correlation will be positive. From this, however, the conclusion “an increase in the number of firefighters leads to an increase in the damage caused” does not follow, and even more so an attempt to minimize the damage from fires by eliminating the fire brigades will not be successful. [5] At the same time, the lack of correlation between the two quantities does not mean that there is no connection between them. For example, a dependency can be complex non-linear in nature, which the correlation does not reveal.
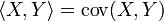
An important characteristic of the joint distribution of two random variables is the covariance (or correlation moment ). Covariance is a second-order joint moment. [6] Covariance is defined as the mathematical expectation of the product of deviations of random variables [7] :
 ,
, Where  - mathematical expectation (in the English literature the designation is accepted
  ).
).
Covariance properties :
 and
and  is zero [8] .
 Because and - independent random variables, then their deviations  and
and  also independent. Using the fact that the mathematical expectation of the product of independent random variables is equal to the product of the mathematical expectations of the factors, and the mathematical expectation of the deviation is zero, we have

and does not exceed the geometric mean of their dispersions:  [9] .
[9] . We introduce a random variable 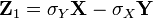 (Where
  - standard deviation) and find its variance
 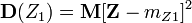 . After completing the calculations we get:

Any variance is non-negative, therefore

From here

Typing a random variable  similarly

Combining these inequalities, we have

Or

So,

To eliminate the lack of covariance, a linear correlation coefficient (or Pearson correlation coefficient ) was introduced, which was developed by Karl Pearson, Francis Edgeworth and Rafael Weldon (Eng.) Russian. in the 90s of the XIX century. The correlation coefficient is calculated by the formula [10] [8] :
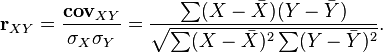
Where  ,
,  - the average value of the samples.
The correlation coefficient ranges from minus one to plus one [11] .
Dividing both sides of the double inequality  on
on  will get
The linear correlation coefficient is associated with the regression coefficient in the form of the following relationship:  Where
Where  - regression coefficient,
  - the standard deviation of the corresponding factor sign [12] .
For a graphical representation of such a relationship, you can use a rectangular coordinate system with axes that correspond to both variables. Each pair of values is marked with a specific symbol. Such a graph is called a “scatterplot”.
The method of calculating the correlation coefficient depends on the type of scale to which the variables belong. Thus, to measure variables with interval and quantitative scales, it is necessary to use the Pearson correlation coefficient (correlation of the moments of products). If at least one of the two variables has an ordinal scale, or is not normally distributed, you must use the Spearman rank correlation or  (tau) kendall. In the case when one of the two variables is dichotomous, a point-like two-row correlation is used, and if both variables are dichotomous: the four-field correlation. The calculation of the correlation coefficient between two non-dichotomous variables is not devoid of meaning only when the connection between them is linear (unidirectional).
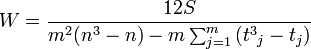
It is used to identify the relationship between quantitative or qualitative indicators, if they can be ranked. The values of the indicator X are set in ascending order and assigned to their ranks. The values of the indicator Y are ranked and the Kendall correlation coefficient is calculated:
 ,
,
Where  .
.
 - the total number of observations following the current observations with a large value of the ranks Y.
 - the total number of observations following the current observations with a lower value of the ranks of Y. (equal ranks are not counted!)

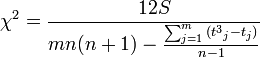
If the studied data is repeated (have the same ranks), then the corrected Kendall correlation coefficient is used in the calculations:


 - the number of related ranks in the series X and Y, respectively.
The degree of dependence of two random variables (features) X and Y can be characterized on the basis of the analysis of the obtained results.  . Each indicator X and Y is assigned a rank. The ranks of the values of X are arranged in the natural order i = 1, 2,. . ., n. The rank of Y is written as Ri and corresponds to the rank of the pair (X, Y) for which the rank of X is equal to i. Based on the obtained Xi and Yi ranks, their differences are calculated
  and calculates the Spearman correlation coefficient:

The value of the coefficient varies from −1 (the sequence of ranks is completely opposite) to +1 (the sequence of ranks completely coincide). A value of zero indicates that the signs are independent.
The number of matches and discrepancies of the signs of deviations of the values of indicators from their average value is calculated.

C is the number of pairs in which the signs of deviations of values from their averages coincide.
H is the number of pairs in which the signs of the deviations of values from their averages do not match.
 - the number of groups that are ranked.
 - number of variables.
 - rank
  -factor
  -units
Significance:

 , the hypothesis of a lack of communication is rejected.
If there are related ranks:
 then the norm of the random variable will be equal to
 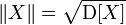 , and the consequence of the Cauchy-Bunyakovsky inequality will be:
  .
.  then and only if
  and
and  linearly dependent (except for events of zero probability, when several points are “knocked out” of a straight line reflecting the linear dependence of random variables):
  ,
,  . Moreover in this case the signs
  and
and  match up:
  .
. Consider random variables X and Y with zero means and variances equal, respectively,  and
and  . Calculate the variance of the random variable
  :
:

Assuming that the correlation coefficient
the previous expression will be rewritten as

Since you can always choose the numbers a and b so that  (for example, if
  , then we take arbitrary a and
  ), then with these a and b dispersion
  and mean
 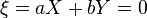 almost sure. But this means a linear relationship between X and Y. The proof is obviously generalized to the case of X and Y with nonzero means, only in the above calculations it will be necessary to replace X with
  and Y - on
  .
.
 independent random variables then
  . The reverse is generally not true.
 Correlation analysis is a method of processing statistical data by which the closeness of the relationship between two or more variables is measured. Correlation analysis is closely related to regression analysis (the term “ correlation and regression analysis ” is also often encountered, which is a more general statistical concept), determines the need to include certain factors in the multiple regression equation, and also evaluates the obtained regression equation for identified relationships (using the coefficient of determination). [1] [2]
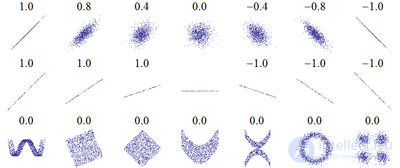
 with corresponding correlation coefficients for each of them. The correlation coefficient reflects the “noisiness” of the linear dependence (upper line), but does not describe the slope of the linear dependence (middle line), and is not at all suitable for describing complex, non-linear dependencies (lower line). For the distribution shown in the center of the figure, the correlation coefficient is not defined, since the variance y is zero.
 This method of processing statistical data is very popular in economics and social sciences (particularly in psychology and sociology), although the scope of application of the correlation coefficients is extensive: quality control of industrial products, metallography, agrochemistry, hydrobiology, biometrics, and others. In various applied industries, different interval boundaries have been adopted to assess the closeness and significance of communication.
The popularity of the method is due to two points: the correlation coefficients are relatively simple to calculate, their use does not require special mathematical preparation. Combined with the simplicity of interpretation, the simplicity of applying the coefficient has led to its wide distribution in the field of statistical data analysis.
Correlation - the relationship of signs (may be positive or negative). Due to gene linkage or pleiotropy [15]

Comments
To leave a comment
Probability theory. Mathematical Statistics and Stochastic Analysis
Terms: Probability theory. Mathematical Statistics and Stochastic Analysis