Lecture
For clarity, various graphs of statistical distribution are constructed, in particular, a polygon and a histogram.
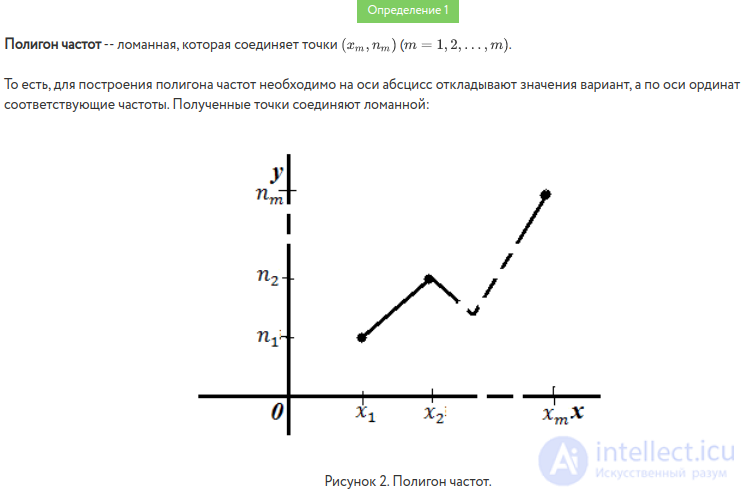
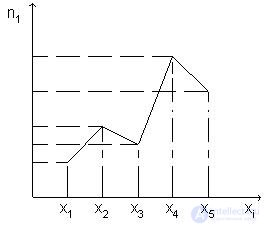
Frequency range is a polyline, the segments of which connect the points 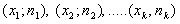 . To build a range of frequencies on the x-axis, lay the options
  , and on the y-axis - the corresponding frequency
  and connect the dots
  straight line segments.
The range of relative frequencies is constructed similarly, except that relative frequencies are plotted on the ordinate axis  .
.
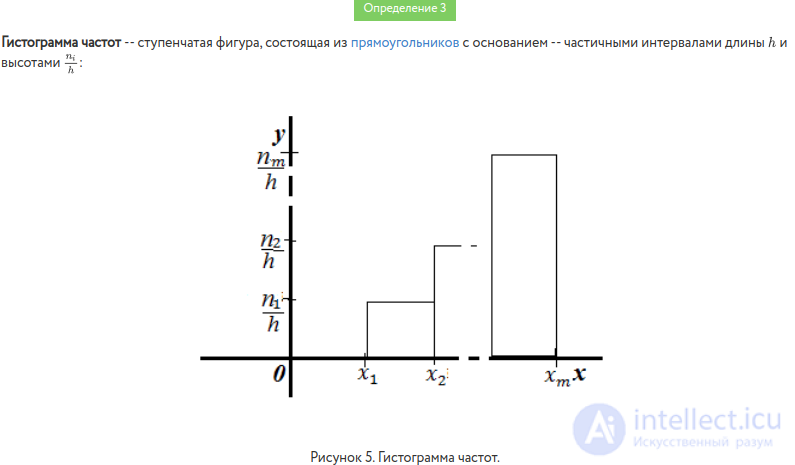
In the case of a continuous feature, a histogram is built, for which the interval in which all the observed values of the feature are enclosed is divided into several partial intervals of length h and found for each partial interval  - the sum of frequencies of an option that fell into the i – th interval.
The histogram of frequencies is called a step shape consisting of rectangles, the bases of which are partial intervals of length h, and the heights are equal to the ratio  . To construct a histogram of frequencies on the x-axis lay partial intervals, and above them spend the segments parallel to the x-axis at a distance (height)
  . The area of the i – th rectangle is
  - the sum of frequencies is a variant of the i – о interval, therefore the area of the frequency histogram is equal to the sum of all frequencies, i.e. sample size.
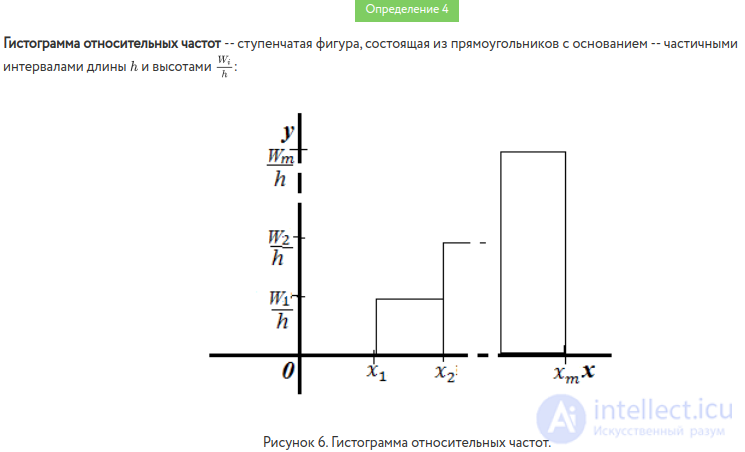
In the case of relative frequency histograms, relative frequencies are plotted along the ordinate axis  , on the abscissa axis - partial intervals, over them spend the segments parallel to the abscissa axis at the height
  . The area of the i – th rectangle is equal to the relative frequency
  trapped in the i – th interval. Therefore, the area of the histogram of relative frequencies is equal to the sum of all relative frequencies, that is, one.
For clarity, build various graphs of statistical distribution.
According to a discrete variation series, a range of frequencies or relative frequencies are built.
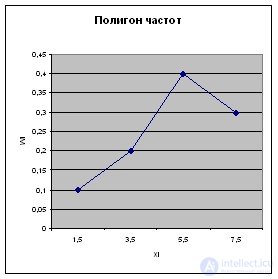
Frequency range is a broken line whose segments connect the points ( x 1 ; n 1 ), ( x 2 ; n 2 ), ..., ( x k ; n k ). To build a range of frequencies on the x- axis lay the options x i , and on the y-axis - the corresponding frequency n i . Points ( x i ; n i ) are connected by straight lines and receive a range of frequencies (Fig. 1).
The polygon of relative frequencies is called a broken line, the segments of which connect the points ( x 1 ; W 1 ), ( x 2 ; W 2 ), ..., ( x k ; W k ). To build a polygon of relative frequencies on the x- axis lay options x i , and on the y-axis - the corresponding relative frequencies W i . Points ( x i ; W i ) are connected by straight line segments and receive a range of relative frequencies.
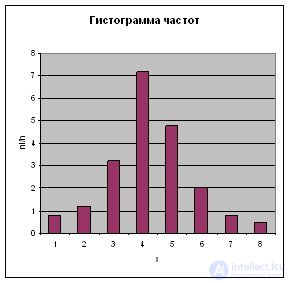
In the case of a continuous feature, it is advisable to build a histogram .
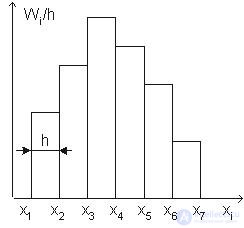
The histogram of frequencies is called a stepped figure, consisting of rectangles, the bases of which are partial intervals of length h , and the heights are equal to the ratio n i / h (frequency density).
To construct a histogram of frequencies on the x-axis lay partial intervals, and on them spend the segments parallel to the x-axis at a distance of n i / h .
The area of the i - th partial rectangle is equal to hn i / h = n i - the sum of the frequencies of the variant of the i - th interval; therefore, the area of the frequency histogram is equal to the sum of all frequencies, i.e. sample size .
The histogram of relative frequencies is called a step shape, consisting of rectangles, the bases of which are partial intervals of length h , and the heights are equal to the ratio W i / h (relative frequency density).
To construct a histogram of relative frequencies, partial intervals are laid on the abscissa axis, and over them are carried out segments parallel to the abscissa axis at distance W i / h (Fig. 2).
The area of the i - th partial rectangle is equal to hW i / h = W i - to the relative frequency of the variant in the i - th interval. Consequently, the area of the histogram of relative frequencies is equal to the sum of all relative frequencies, i.e. unit .
|
Fig. 1. Frequency range |
Fig. 2. Histogram of relative frequencies |


Comments
To leave a comment
Probability theory. Mathematical Statistics and Stochastic Analysis
Terms: Probability theory. Mathematical Statistics and Stochastic Analysis