Lecture
Content
Statistical aggregate is a set of units with mass character, typicalness, qualitative homogeneity, and the presence of variation.
The statistical aggregate consists of materially existing objects (Workers, enterprises, countries, regions), is the subject of statistical research.
Unit of aggregate - each specific unit of the statistical aggregate.
One and the same statistical aggregate may be homogeneous in one feature and heterogeneous in another.
Qualitative homogeneity - the similarity of all units of the aggregate on any basis and dissimilarity on all others.
In a statistical aggregate, differences of one aggregate unit from another are more often of a quantitative nature. Quantitative changes in the values of the trait of different aggregate units are called variation.
Character variation - a quantitative change of a character (for a quantitative characteristic) during the transition from one unit of the population to another.
A sign is a property, characteristic feature or other feature of units, objects and phenomena that can be observed or measured. Signs are divided into quantitative and qualitative. The diversity and variability of the size of the trait of individual units of the population is called variation .
Attributive (qualitative) attributes are not amenable to numerical expression (composition of the population by sex). Quantitative attributes have a numerical expression (composition of the population by age).
The indicator is a generalizing quantitatively qualitative characteristic of a property of units or a set of objectives in specific conditions of time and place.
The system of indicators is a set of indicators that comprehensively reflect the phenomenon being studied.
For example, the salary is studied:
The basis of the statistical study is a set of data obtained as a result of measuring one or several signs. Really observable collection of objects, statistically represented by a number of observations  random variable
  , is a sample , and hypothetically existing (speculated) - the general population . The general population can be finite (the number of observations N = const ) or infinite ( N = ∞ ), and the sample from the general population is always the result of a limited series
  observations. The number of observations forming the sample is called the sample size . If the sample size a large enough ( n → ∞ ) sample is considered large , otherwise it is called a sample of limited volume . A sample is considered small if, when measuring a one-dimensional random variable the sample size does not exceed 30 ( n <= 30 ), and when measuring several ( k ) features simultaneously in a multidimensional space, the ratio n to k does not exceed 10 (n / k <10) . A sample forms a variational series if its members are ordinal statistics , i.e., the sample values of the random variable X are ordered in ascending order (ranked), the values of the characteristic are called variants .
An example . Almost the same randomly selected set of objects - commercial banks of one administrative district of Moscow, can be considered as a sample from the general population of all commercial banks of this district, and as a sample from the general population of all commercial banks in Moscow, as well as a sample from commercial banks of the country and etc.
Reliability of statistical findings and meaningful interpretation of the results depends on the representativeness of the sample, i.e. completeness and adequacy of the representation of the properties of the general population, in relation to which this sample can be considered representative. The study of the statistical properties of an aggregate can be organized in two ways: with the help of continuous and non- continuous observation. Continuous observation provides for the survey of all units of the studied population , and non- continuous (selective) observation - only parts of it.
There are five main ways to organize sampling:
1. simple random selection , in which objects are randomly extracted from the general population  objects (for example, using a table or a random number sensor), and each of the possible samples have an equal probability. Such samples are called self-random ;
2. simple selection using a regular procedure is carried out using a mechanical component (for example, dates, days of the week, apartment numbers, letters of the alphabet, etc.) and the samples obtained in this way are called mechanical ;
3. stratified selection is that the total population subdivided into subsets or layers (strata) of volume so that . Strata are homogeneous objects from the point of view of statistical characteristics (for example, the population is divided into strata by age groups or social affiliation; enterprises by industry). In this case, the samples are called stratified (otherwise, stratified, typical, zoned );
4. serial selection methods are used to form serial or cluster samples . They are convenient if it is necessary to inspect at once a “block” or a series of objects (for example, a consignment of goods, products of a certain series or a population in the territorial-administrative division of a country). The selection of the series can be done in a self-random or mechanical way. At the same time, a complete survey of a certain consignment of goods, or of an entire territorial unit (apartment building or block) is carried out;
5. combined (staged) selection can combine several selection methods at once (for example, stratified and random or random and mechanical); This sample is called a combination .
Types of selection
By the form of individual, group and combined selection. In case of individual selection , individual units of the general population are selected in the sample, in group selection , qualitatively homogeneous groups (series) of units, and combined selection assumes a combination of the first and second types.
According to the selection method distinguish between repeated and non-repeated sampling.
Selection is called non-repeated , in which the unit in the sample is not returned to the original population and does not participate in the further selection; while the number of units of the general population N is reduced in the selection process. In the repeated selection, the unit that was selected in the sample after registration returns to the general population and thus preserves the equal possibility, along with other units, to be used in the further selection procedure; at the same time, the number of units of the general population N remains unchanged (the method is rarely used in socio-economic research). However, with large N (N → ∞), formulas for non -repeated selection approach those similar to repeated selection and the latter are used more often ( N = const ).
The basis of the statistical findings of the study lies in the distribution of the random variable , the observed values (x1, x2, ..., xn) are called realizations of the random variable X (n is the sample size). Random distribution in general, it has a theoretical, ideal character, and its selective analogue is an empirical distribution. Some theoretical distributions are given analytically, i.e. their parameters determine the value of the distribution function  at every point in the space of possible values of a random variable . For the sample, the distribution function is difficult to determine, and sometimes it is impossible, therefore, the parameters are estimated from empirical data, and then they are substituted into an analytical expression describing the theoretical distribution. In this case, the assumption (or hypothesis ) of the type of distribution can be both statistically correct and erroneous. But in any case, the empirical distribution recovered from the sample only roughly describes the true distribution. The most important parameters of the distributions are the expectation
  and variance
  .
.
By their nature, distributions are continuous and discrete . The most famous continuous distribution is normal . Selective analogues of parameters and for him are: mean  and empirical dispersion
  . Among the discrete in the socio-economic research most often used alternative (dichotomous) distribution. Expectation parameter of this distribution expresses the relative value (or proportion ) of aggregate units that possess the characteristic being studied.
  (it is indicated by the letter
  ); the proportion of the population that does not possess this feature is denoted by the letter q (q = 1 - p) . Dispersion same alternative distribution also has an empirical analogue .
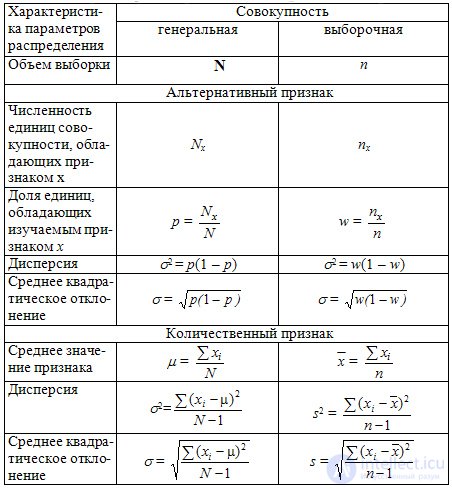
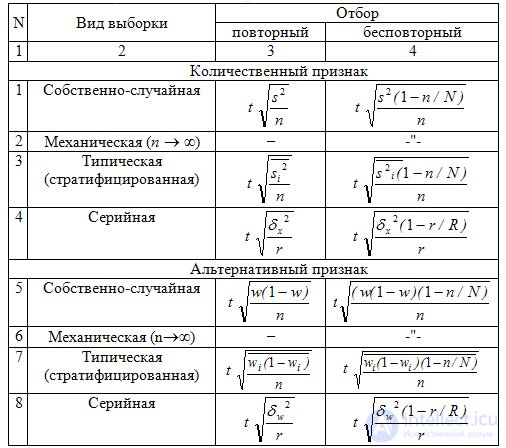
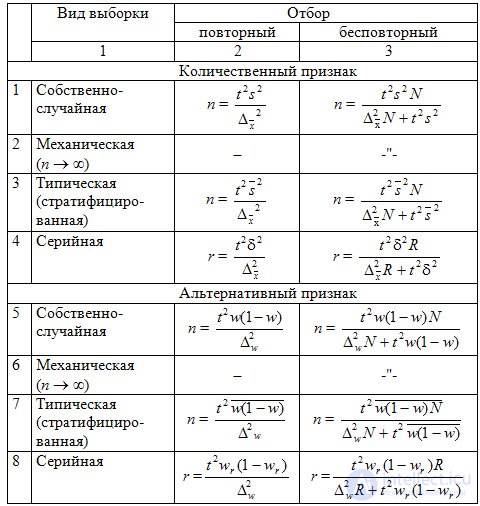
Depending on the type of distribution and on the method of selecting units of the population, the characteristics of the distribution parameters are calculated differently. The main ones for theoretical and empirical distributions are given in Table. 9.1.
The proportion of the sample kn is the ratio of the number of units of the sample to the number of units of the total population:
kn = n / n .
The sample share w is the ratio of units that have the characteristic x to the sample size n :
w = nn / n .
Example. In a consignment of goods containing 1000 units, with a 5% sample, the proportion of the kn sample in the absolute value is 50 units. (n = N * 0.05); if 2 defective items are found in this sample, then the sampling fraction w will be 0.04 (w = 2/50 = 0.04 or 4%).
Since the sampling frame is different from the general one, sampling errors occur.
Table 9.1 The main parameters of the general and selective sets
In any statistical observation (continuous and selective) errors of two types can occur: registration and representativeness. Registration errors can be random and systematic . Random errors are made up of many different uncontrollable causes, are unintentional and usually collectively balance each other (for example, changes in the device performance during temperature fluctuations in the room).
Systematic errors are tendentious, since they violate the rules for selecting objects in the sample (for example, deviations in measurements when changing the setting of the measuring instrument).
Example. To assess the social situation of the population in the city, it is envisaged to examine 25% of families. If the choice of every fourth apartment is based on its number, then there is a danger of selecting all the apartments of only one type (for example, one-room), which will provide a systematic error and distort the results; the choice of the same apartment number by lot is more preferable, since the error will be random.
Representativeness errors are inherent only in selective observation, they cannot be avoided and they arise as a result of the fact that the sampling set does not fully reproduce the general set. The values of the indicators obtained from the sample differ from those of the same values in the general population (or obtained by continuous observation).
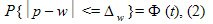
Sampling error  there is a difference between the value of the parameter in the population and its sample value. For the average value of a quantitative trait, it is equal to: , and for a share (alternative attribute) - .
Sampling errors are peculiar only to selective observations. The more these errors, the more the empirical distribution differs from the theoretical one. Empirical distribution parameters and are random variables, therefore, sampling errors are also random variables, can take different values for different samples, and therefore it is customary to calculate the average error .
The average sampling error is the value  expressing the standard deviation of the sample mean from the expectation. This value, while respecting the principle of random selection, depends primarily on the sample size and on the degree of variation of the trait: the more and the smaller the variation of the trait (and hence the value ), the smaller the value of the average sampling error
  . The ratio between the dispersions of the general and selective sets is expressed by the formula:
those. for large enough can be considered that  . Средняя ошибка выборки показывает возможные отклонения параметра выборочной совокупности от параметра генеральной. In tab. 9.2 приведены выражения для вычисления средней ошибки выборки при разных методах организации наблюдения.
Таблица 9.2 Средняя ошибка (m) выборочных средней и доли для разных видов выборки
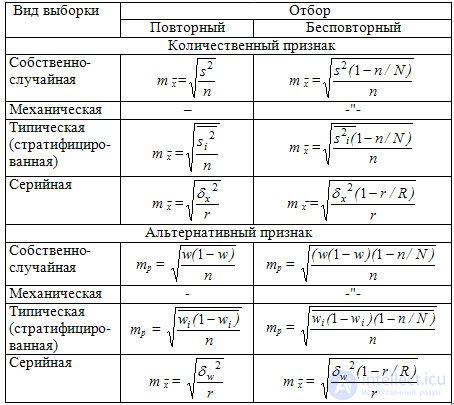
Где  - средняя из внутригрупповых выборочных дисперсий для непрерывного признака;
 - средняя из внутригрупповых дисперсий доли;
 — число отобранных серий,
  — общее число серий;
 ,
,
Where  — средняя
  -й серии;
— общая средняя по всей выборочной совокупности для непрерывного признака;
 ,
,
Where  — доля признака в -й серии;
 — общая доля признака по всей выборочной совокупности.
Однако о величине средней ошибки можно судить лишь с определенной, вероятностью Р (Р ≤ 1). Ляпунов А.М. доказал, что распределение выборочных средних , a следовательно, и их отклонений от генеральной средней, при достаточно большом числе приближенно подчиняется нормальному закону распределения при условии, что генеральная совокупность обладает конечной средней и ограниченной дисперсией.
Математически это утверждение для средней выражается в виде:

а для доли выражение (1) примет вид:
Where 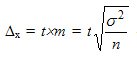 - есть предельная ошибка выборки , которая кратна величине средней ошибки выборки , а коэффициент кратности
  — есть критерий Стьюдента ("коэффициент доверия"), предложенный У.С. Госсетом (псевдоним "Student"); values for different sample sizes are stored in a special table.
The values of the function f (t) for some values of t are:
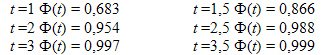
Therefore, the expression (3) can be read as follows: with probability P = 0.683 (68.3%), it can be argued that the difference between the sample and the general average does not exceed one value of the mean error m (t = 1) , with probability P = 0.954 (95.4%) - that it does not exceed the value of two mean errors m (t = 2), with a probability P = 0.997 (99.7%) - does not exceed three values of m (t = 3). Thus, the probability that this difference will exceed three times the average error determines the level of error and is no more than 0.3% .
In tab. 9.3 provides formulas for calculating marginal sampling errors.
Таблица 9.3 Предельная ошибка (D) выборки для средней и доли (р) для разных видов выборочного наблюдения
Конечной целью выборочного наблюдения является характеристика генеральной совокупности. При малых объемах выборки эмпирические оценки параметров ( and  ) могут существенно отклоняться от их истинных значений ( and ). Поэтому возникает необходимость установить границы, в пределах которых для выборочных значений параметров ( and ) лежат истинные значения ( and ).
Доверительным интервалом какого-либо параметра θгенеральной совокупности называется случайная область значений этого параметра, которая с вероятностью близкой к 1 ( надежностью ) содержит истинное значение этого параметра.
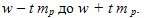
Предельная ошибка выборки Δ позволяет определить предельные значения характеристик генеральной совокупности и их доверительные интервалы , которые равны:

Нижняя граница доверительного интервала получена путем вычитания предельной ошибки из выборочного среднего (доли), а верхняя — путем ее добавления.
Доверительный интервал для средней использует предельную ошибку выборки и для заданного уровня достоверности определяется по формуле:
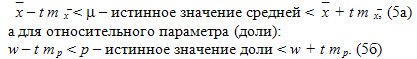
This means that with a given probability P , which is called the confidence level and is uniquely determined by the value of t , it can be argued that the true value of the average lies in the range of 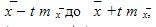 , and the true value of the fraction lies in the range of
When calculating the confidence interval for the three standard confidence levels P = 95%, P = 99% and P = 99.9%, the value is selected according to the Student table. Applications depending on the number of degrees of freedom .If the sample size is large enough, then the values of t corresponding to these probabilities are: 1.96, 2.58, and 3.29 . Thus, the marginal error of the sample allows you to determine the limiting values of the characteristics of the population and their confidence intervals:
The distribution of the results of sampling observation to the general population in socio-economic research has its own characteristics, since it requires the completeness of the representativeness of all its types and groups. The basis for the possibility of such distribution is the calculation of the relative error :
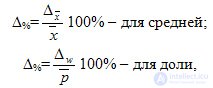
where Δ % is the relative marginal sampling error; ,  .
.
Существуют два основных метода распространения выборочного наблюдения на генеральную совокупность: прямой пересчет и способ коэффициентов .
Сущность прямого пересчета заключается в умножении выборочного среднего значения !!\overline{x} на объем генеральной совокупности .
An example . Пусть среднее число детей ясельного возраста в городе оценено выборочным методом и составило человека. Если в городе 1000 молодых семей, то число необходимых мест в муниципальных детских яслях получают умножением этой средней на численность генеральной совокупности N = 1000, т.е. составит 1200 мест.
Способ коэффициентов целесообразно использовать в случае, когда выборочное наблюдение проводится с целью уточнения данных сплошного наблюдения.
При этом используют формулу:
 ,
,
где все переменные — это численность совокупности:
 — с поправкой на недоучет,
 - без этой поправки,
 — в контрольных точках
 — в тех же точках по данным контрольных мероприятий.
Таблица 9.4 Необходимый объем (n) выборки для разных видов организации выборочного наблюдения
При планировании выборочного наблюдения с заранее заданным значением допустимой ошибки выборки необходимо правильно оценить требуемый объем выборки . Этот объем может быть определен на основе допустимой ошибки при выборочном наблюдении исходя из заданной вероятности  , гарантирующей допустимую величину уровня ошибки (с учетом способа организации наблюдения). Формулы для определения необходимой численности выборки n легко получить непосредственно из формул предельной ошибки выборки. Так, из выражения для предельной ошибки:

непосредственно определяется объем выборки n :

Эта формула показывает, что с уменьшением предельной ошибки выборки Δ существенно увеличивается требуемый объем выборки , который пропорционален дисперсии и квадрату критерия Стьюдента .
Для конкретного способа организации наблюдения требуемый объем выборки вычисляется согласно формулам, приведенным в табл. 9.4.
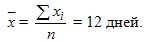
Пример 1. Вычисление среднего значения и доверительного интервала для непрерывного количественного признака.
Для оценки скорости расчета с кредиторами в банке проведена случайная выборка 10 платежных документов. Их значения оказались равными (в днях): 10; 3; 15; 15; 22; 7; eight; one; nineteen; 20.
Необходимо с вероятностью Р = 0,954 определить предельную ошибку Δ выборочной средней и доверительные пределы среднего времени расчетов.
Decision. Среднее значение вычисляется по формуле из табл. 9.1 для выборочной совокупности
Дисперсия вычисляется по формуле из табл. 9.1.

Средняя квадратическая погрешность  дня.
дня.
Ошибка средней вычисляется по формуле:
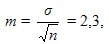
those. среднее значение равно x ± m = 12,0 ± 2,3 дней .
Достоверность среднего составила
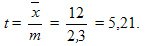
Предельную ошибку вычислим по формуле из табл. 9.3 для повторного отбора, так как численность генеральной совокупности неизвестна, и для Р = 0,954 уровня достоверности.
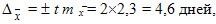
Таким образом, среднее значение равно `x ± D = `x ± 2m = 12,0 ± 4,6, т.е. его истинное значение лежит в пределах от 7,4 до16,6 дней.
Использование таблицы Стьюдента. Приложения позволяет заключить, что для n = 10 — 1 = 9 степеней свободы полученное значение достоверно с уровнем значимости a £ 0,001, т.е. полученное значение среднего достоверно отличается от 0.
Пример 2. Оценка вероятности (генеральной доли) р.
При механическом выборочном способе обследования социального положения 1000 семей выявлено, что доля малообеспеченных семей составила w = 0,3 (30%) (выборка была 2% , т.е. n/N = 0,02 ). Необходимо с уровнем достоверности р = 0,997 определить показатель р малообеспеченных семей во всем регионе.
Decision. По представленным значениям функции Ф(t) найдем для заданного уровня достоверности Р = 0,997 значение t = 3 (см. формулу 3). Предельную ошибку доли w определим по формуле из табл. 9.3 для бесповторного отбора (механическая выборка всегда является бесповторной):

Предельная относительная ошибка выборки в % составит:
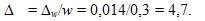
Вероятность (генеральная доля) малообеспеченных семей в регионе составит р=w±Δw , а доверительные пределы р вычисляются исходя из двойного неравенства:
w — Δw ≤ p ≤ w — Δw , т.е. истинное значение р лежит в пределах:
0,3 — 0,014 < p <0,3 + 0,014, а именно от 28,6% до 31,4%.
Таким образом, с вероятностью 0,997 можно утверждать, что доля малообеспеченных семей среди всех семей региона составляет от 28,6% до 31,4%.
Пример 3. Вычисление среднего значения и доверительного интервала для дискретного признака, заданного интервальным рядом.
In tab. 9.5. задано распределение заявок на изготовление заказов по срокам их выполнения предприятием.
Таблица 9.5 Распределение наблюдений по срокам появления
|
Срок выполнения заявок (мес.) |
Число наблюдений fi(абсолютная частота) |
Относительная частота рi (%) |
Середина интервала (градации) признака xi |
|
until 6 |
20 |
ten |
3 |
|
6-12 |
80 |
40 |
9 |
|
12-36 |
60 |
thirty |
24 |
|
36-60 |
20 |
ten |
48 |
|
св.60 |
20 |
ten |
72 |
|
Total |
200 |
100% |
|
Decision. Средний срок выполнения заявок вычисляется по формуле:
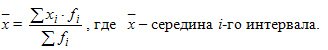
Средний срок составит:
= (3*20 + 9*80 + 24*60 + 48*20 + 72*20)/200 = 23,1 мес.
Тот же ответ получим, если используем данные о рi из предпоследней колонки табл. 9.5, используя формулу:

Заметим, что середина интервала для последней градации находится путем искусственного ее дополнения шириной интервала предыдущей градации равной 60 — 36 = 24 мес.
Дисперсия вычисляется по формуле

где хi - середина интервального ряда.
Следовательно !!\sigma = \frac {20^2 + 14^2 + 1 + 25^2 + 49^2}{4}, а средняя квадратическая погрешность  .
.
Ошибка средней вычисляется по формуле мес., т.е. среднее значение равно !!\overline{x} ± m = 23,1 ± 13,4.
Предельную ошибку вычислим по формуле из табл. 9.3 для повторного отбора, так как численность генеральной совокупности неизвестна, для 0,954 уровня достоверности:

Таким образом, среднее значение равно:
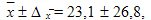
those. его истинное значение лежит в пределах от 0 до 50 мес.
Пример 4. Для определения скорости расчетов с кредиторами N = 500 предприятий корпорации в коммерческом банке необходимо провести выборочное исследование методом случайного бесповторного отбора. Определить необходимый объем выборки n, чтобы с вероятностью Р = 0,954 ошибка среднего значения выборки не превышала 3-х дней, если пробные оценки показали, что среднее квадратическое отклонение s составило 10 дней.
The decision . Для определения числа необходимых исследований n воспользуемся формулой для бесповторного отбора из табл. 9.4:
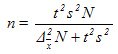
В ней значение t определяется из таблицы Стьюдента для уровня достоверности Р = 0,954. Оно равно 2. Среднее квадратическое значение s = 10, объем генеральной совокупности N = 500, а предельная ошибка среднего значения Δ x= 3. Подставляя эти значения в формулу, получим:
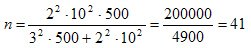
those. It is enough to make a sample of 41 enterprises in order to estimate the required parameter - the speed of settlements with creditors.

Comments
To leave a comment
Probability theory. Mathematical Statistics and Stochastic Analysis
Terms: Probability theory. Mathematical Statistics and Stochastic Analysis