Lecture
Regression analysis is a statistical method for studying the influence of one or several independent variables.  on dependent variable
  . Independent variables are otherwise called regressors or predictors, and dependent variables are criterion variables. The terminology of the dependent and independent variables reflects only the mathematical dependence of the variables ( see False Correlation ), and not cause-effect relationships.
Regression analysis cannot be used to determine whether there is a relationship between variables, since the existence of such a relationship is a prerequisite for applying the analysis.
Strictly regression dependence can be defined as follows. Let be  - random variables with a given joint probability distribution. If for each set of values
  conditional expectation defined
 (regression equation in general),
 that function  called magnitude regression by magnitude
  and its graph is a regression line by or regression equation .
Addiction from manifested in a change in average values when it changes . Although at each fixed set of values magnitude Remains a random variable with a certain distribution.
To clarify the question, how accurately is the regression analysis evaluating the change when it changes , average variance is used with different sets of values (in fact, we are talking about the scattering measure of the dependent variable around the regression line).
In matrix form, the regression equation (SD) is written in the form: 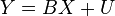 where
where  - error matrix. With the reversible matrix X◤X, we obtain the column vector of the coefficients B, taking into account U◤U = min (B). In the particular case for X = (± 1), the X◤X matrix is rotable, and the SD can be used in the analysis of time series and the processing of technical data.
In practice, the regression line is most often sought as a linear function.  (linear regression) that best approximates the desired curve. This is done using the method of least squares, when the sum of squared deviations of the actually observed
  from their ratings
  (referring to estimates using a straight line that pretends to represent the desired regression dependence):
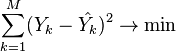
(  - sample size). This approach is based on the well-known fact that the sum appearing in the above expression takes the minimum value for the case when
  .
.
To solve the regression analysis problem using the least squares method, the notion of the residual function is introduced:

The condition of the minimum of the residual function:

The resulting system is a system  linear equations with unknown
  .
.
If we represent the free terms of the left side of the equations by the matrix
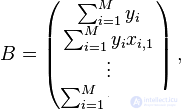
and the coefficients for the unknowns on the right side are matrices

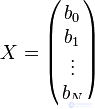
then we get the matrix equation:  which is easily solved by the Gauss method. The resulting matrix will be a matrix containing the coefficients of the equation of the regression line:
To obtain the best estimates, it is necessary to fulfill the prerequisites of the OLS (Gauss – Markov conditions). In the English literature, such estimates are called BLUE ( Best Linear Unbiased Estimators - “the best linear unbiased estimates”). Most of the dependencies studied can be represented using MNC-nonlinear mathematical functions.
Options  are private correlation coefficients;
  interpreted as a fraction of the variance Y, explained
  , while fixing the influence of other predictors, that is, it measures the individual contribution in the explanation of Y. In the case of correlating predictors, there is a problem of uncertainty in the estimates, which become dependent on the order of inclusion of predictors in the model. In such cases, it is necessary to use methods of analysis of correlation and step-by-step regression analysis.
Speaking about non-linear models of regression analysis, it is important to pay attention to whether it is non-linear with independent variables (from a formal point of view easily reduced to linear regression), or non-linear with estimated parameters (causing serious computational difficulties). With the nonlinearity of the first type from the substantive point of view, it is important to distinguish the appearance in the model of members of the form  ,
,  indicating the presence of interactions between signs
  ,
,  etc. (see. Multicollinearity).

Comments
To leave a comment
Probability theory. Mathematical Statistics and Stochastic Analysis
Terms: Probability theory. Mathematical Statistics and Stochastic Analysis