Lecture
In the 1940s and 50s, the theory of reliability, as an independent field of knowledge, was spread mainly in the aviation, military and nuclear industries. In fact, the United States is becoming the "homeland" of the reliability theory in 1950, which is primarily associated with the development of electronics. It was then that the United States Secretary of Defense revealed that maintaining a usable electronic equipment costing $ 1 costs a year $ 2. It became obvious that it was necessary to develop the elements of the system initially reliable. The systems were so complex, and the elements of the system influenced such a large number of different functions that only the most precise and rigorous actions of trained service engineers could ensure the minimum required level of reliability. As a result, when announcing a tender for the supply of electronic equipment, the Minister of Defense demanded that equipment manufacturers, after a long test, prove the reliability of their equipment. The results of these tests and compiled the first known database on reliability "Military Standard 217. Reliability prediction of electronic equipment".
At the same time, in 1962, Bell Labs used the method of analyzing a fault tree (fault tree analysis, FTA) for the US Air Force, which today is widely used to analyze the causes of static system failures.
This method is part of national standards, such as the US standard "MIL-HDBK-217 Reliability prediction of electronic equipment" or the Russian "Guidelines for conducting risk analysis of hazardous production facilities No. РД 03-418-01".
The tree of failures (accidents, incidents, consequences, undesirable events, etc.) underlies the logical-probabilistic model of the causal relationships of system failures with failures of its elements and other events (impacts). When analyzing the occurrence of a failure, a failure tree consists of sequences and combinations of violations and malfunctions, and thus it represents a multi-level graphological structure of causal relationships resulting from tracking dangerous situations in reverse order to find possible causes of their occurrence (Figure 1. Conditional scheme of building a tree of failures).
Figure 1. Conditional scheme of building a tree of failures
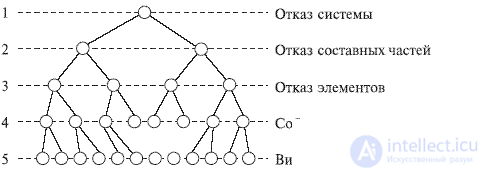
This method implements a deductive method (causes - effects), which gives the method the most serious opportunities to find the root causes of events for static systems, as it provides a clear and detailed diagram of the interrelationships of infrastructure elements and events affecting their reliability.
The value of a fault tree is as follows:
analysis focuses on finding failures;
allows you to show explicitly unreliable places;
is provided with graphics and provides visual material for the part of IT professionals who are involved in the maintenance of the system;
allows you to perform a qualitative or quantitative analysis of the reliability of the system;
the method allows specialists to alternately focus on individual specific system failures;
provides a deep understanding of the behavior of the system and penetration into the process of its work;
are a means of communication of specialists, as they are presented in a clear visual form;
helps to deductively detect failures;
gives designers, users and managers the opportunity to visually justify design changes or establish the degree of compliance of the system design with specified requirements and analysis of trade-off decisions;
facilitates the analysis of the reliability of complex systems.
The main advantage of the fault tree (compared to other methods) is that the analysis is limited to identifying only those elements of the system and events that lead to this particular system failure or accident.
The disadvantages of the failure tree are as follows:
implementation of the method requires a significant investment of time and money, since an increase in the detail of the infrastructure under consideration leads to a geometric increase in the number of influencing events;
the fault tree is a scheme of Boolean logic, which show only two states: working and failed;
It is difficult to take into account the state of partial failure of elements, because when using the method, as a rule, it is considered that the system is either in good condition or in a state of failure;
difficulties in the general case of an analytical solution for trees, containing backup nodes and reestablished nodes with priorities, not to mention the significant efforts that are required to cover all types of multiple failures;
requires reliability specialists to have a deep understanding of the system and a specific review each time with only one specific failure;
the fault tree describes the system at a certain point in time (usually in steady state), and the sequence of events can be shown with great difficulty, sometimes it is impossible. This is true for systems that have complex control loops, in such cases, as a rule, refer to methods based on stochastic (random) processes.
In order to find and visualize a causal relationship using a fault tree, elementary blocks are necessary that divide and link a large number of events. There are two types of blocks: logical symbols (signs) and event symbols.
Boolean characters. Logical symbols (signs) link events in accordance with their causal relationships. The designations of the logical signs are given in Table 1. The meaning of the logical symbols of the failure tree A logical symbol (sign) can have one or several inputs, but only one output, or an output event.
The logical sign "AND" (coincidence scheme). The output event of the logical sign And comes in the event that all input events appear simultaneously.
The rule of formulation of events. Events that are input with respect to operation I must be formulated so that the second is conditional with respect to the first, the third is conditional with respect to the first and second, and the last is conditional with all previous ones. In addition, at least one of the events must be associated with the appearance of the output event.
Full event characterization is not required. Sometimes it even interferes with the graphic clarity of the chart. It is required only to arrange the events in such a way that the person standing on the right depends on the appearance of the person standing on the left. Thus, the appearance of the output event will be determined by the appearance of the last event in the series of N - events.
The rule of application of the logical sign I. If there are several reasons that must appear simultaneously, then usually use the operation I. The inputs of the operation must answer the question: "What is necessary for the appearance of the output event?".
Table 1. The value of the logical symbols of the failure tree
| No | Character of logical sign | Name of the logical sign | Causal relationship |
|---|---|---|---|
| one |
|
AND | The output event occurs if all input events occur simultaneously. |
| 2 |
|
OR | The output event occurs if any of the input events occurs. |
| 3 |
|
Ban | The presence of an input causes the presence of an exit when a conditional event occurs. |
| four |
|
Priority And | The output event happens if all input events occur in the desired order from left to right |
| five |
|
Exclusive OR | The output event happens if one (but only one) of the output events happens |
| 6 |
|
"m from n" (votes or selections) | The output event happens if m happens from n input events |
The logical sign "OR" (merge scheme). The output event of the logical sign OR occurs if any of the input events takes place.
The rule of formulation of events. Events input in relation to the OR operation should be formulated so that they together exhaust all possible ways of occurrence of the output event. In addition, any of the input events should result in an output event.
The rule does not provide a way of describing events, but it must be fulfilled when building a failure tree.
The rule of application of the logical sign OR. If any of the reasons result in an output event, use the OR operation. The inputs of the operation answer the question: "What events are sufficient for the appearance of the output event?".
The order of application of logical signs AND and OR. For any event subject to further analysis, first all possible events are considered, which are the inputs of the OR operations, then the inputs of the operations I. This is true both for the head event and for any event, the analysis of which should be continued.
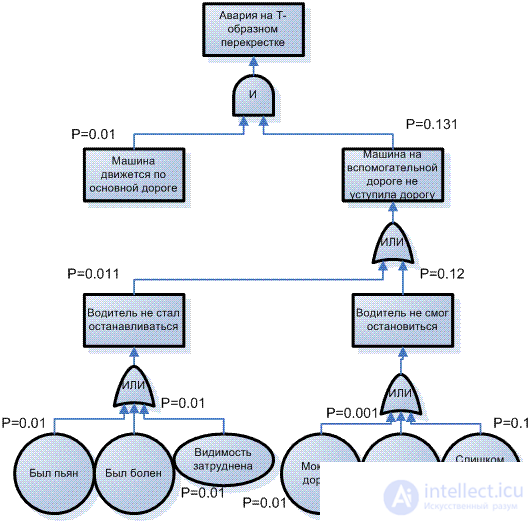
Examples of these two logical signs are shown in Fig. Figure 5. An example of a scheme for building a failure tree with an indication of the probability of events.
Causal relations, expressed by the logical signs AND and OR, are deterministic, since the occurrence of the output event is completely determined by the input events.
The logical sign of the ban. The hexagon, which is a logical prohibition and located in row 3 Table 1. The value of the logical symbols of the fault tree is used to represent probabilistic causal relationships. An event placed under a logical prohibition is called an input event, while an event located to the side of a logical sign is called a conditional event. A conditional event takes the form of an event subject to the occurrence of an input event. An output event occurs if both an input and a conditional event occur. In other words, an input event triggers an output event with the probability (usually constant) of a conditional event. The logical sign of the prohibition often appears in cases when an event is triggered on demand. It is used primarily for convenience and can be replaced by the logical sign I.
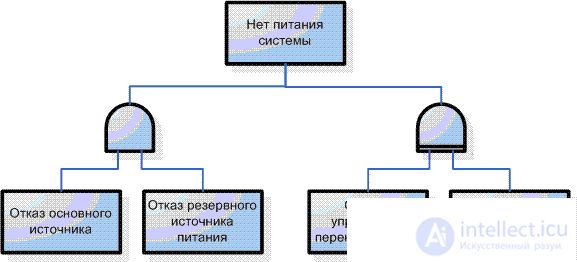
An exit event occurs when the input events occur in a specific sequence (from left to right). The appearance of input events in a different order does not trigger an output event. Consider, for example, a system that has a main power supply and a backup one. The backup power source is automatically activated by a switch when the main source fails. There is no power to the system if:
Both primary and backup sources fail;
the switch first fails and then the main power supply fails.
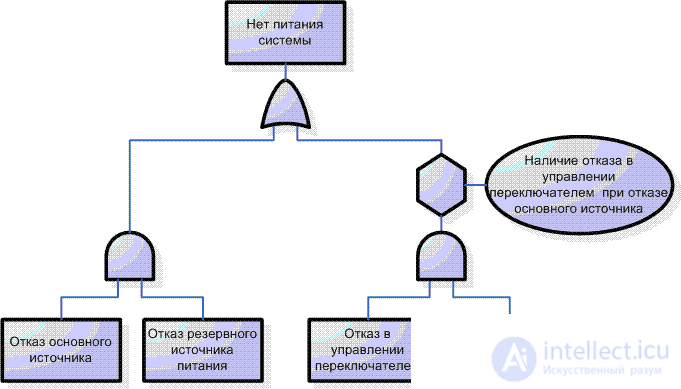
It is assumed that if the failure of the switch is followed by a failure of the main source, this will not lead to loss of power, provided that the backup source is operating normally. The logical symbol "priority AND" can be represented by a combination of "logical AND" and the sign of "prohibition", and therefore, these logical signs are equivalent to "logical AND". The conditional event for the "logical prohibition" is that the input events of the logical sign AND occur in a certain sequence. An example is shown in Figure 22. An example of using the logical sign “priority AND”.
Figure 2. An example of using the logical sign “priority AND”
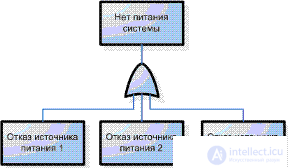
The logical symbol "exclusive OR" (line 5 in Table 1. Meaning of logical symbols of the fault tree) describes a situation in which an output event occurs when one of two (but not both) events occur at the input. As an example, consider a system powered by two generators. Partial loss of power can be represented by the "exclusive OR" element. “Exclusive OR” can be replaced by a combination of logical elements AND and OR, which is illustrated in Figure 3. Equivalent representation of the logical sign “exclusive OR. Usually, in a fault tree, the use of healthy states, such as a “generator running”, is avoided, as they greatly complicate quantitative analysis. A reasonable approach is to replace the logical character "exclusive OR" with a combination of AND and OR characters.
Figure3. Equivalent representation of the logical sign "exclusive OR"
The logical sign of the vote m of n (line 6 in Table 1. The value of the logical symbols of the failure tree) has n input events, and the output event appears if at least m of n input events occur. Consider a system failure that maintains performance until two of the three power supplies turn off. Suppose the system is turned off if and only if two of the three power supplies have failed. Thus, an unnecessary shutdown of the system occurs if two or more control devices give a false signal to shut down while the system is in normal condition.
This situation can be represented by the “two out of three” logical element, as shown in Fig. 4, a. Element vote (choice) is equivalent to a combination of logical elements AND and OR.
Figure 4. An example of applying the logical sign “two out of three”
It is also convenient to use a tree of failures in combination with the probabilities of occurrence of certain events. An example of such a tree is given for analyzing the causes of car accidents at a T-junction, which is shown in Figure 5. An example of a failure tree diagram with an indication of the probability of events
Figure 5. An example of a scheme of building a failure tree with an indication of the probability of events
The fault tree analysis method (FTA) contributes to a thorough analysis of the causes of technical system failures and the development of measures that are most effective for eliminating them. This analysis is carried out for each period of operation, each part or system as a whole.


Comments
To leave a comment
Diagnostics, maintenance and repair of electronic and radio equipment
Terms: Diagnostics, maintenance and repair of electronic and radio equipment