Lecture
Key concepts of this article: network planning (network analysis), network schedule, critical path method, critical path, work reserves (private and general), early and late work periods, PERT (Program Evaluation and Review Technique).
Related topics: “Scheduling and Gantt Chart”, “Work breakdown structure (WBS)”.
You can also get acquainted with our proposals for consulting and staff training in the field of project management.
Modern projects are sometimes very complex and include hundreds and thousands of work performed by different specialists and external contractors. Therefore, planning is indispensable.
Network planning is a set of methods that is designed to manage the project schedule. Its main tool is a network that allows you to:
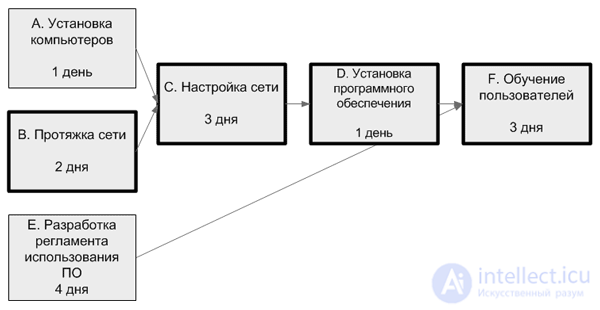
The following describes the algorithm for constructing and applying network graphics .
|
Operation |
Immediately prior operations |
Duration |
|
A. Installing computers |
- |
one |
|
B. Broach network |
- |
2 |
|
C. Network Setup |
A, B |
3 |
|
D. Software Installation |
C |
one |
|
E. Development of software use regulations |
- |
four |
|
F. User training |
D, E |
3 |
The network diagram underlies not only the critical path method, but also another method: PERT (Program Evaluation andReview Technique) . It is distinguished by the fact that it takes into account the probabilistic estimate of the duration of the work.
For each job, experts give an estimate of the duration. Distinguish optimistic, pessimistic and expected duration. Then the duration is entered into the network schedule, which takes into account all the estimates and is calculated by the formula (the coefficients are subject to change):
Duration = (Optimistic + Expected * 4 + Pessimistic) / 6
The next planning step is usually the construction of the Gantt Chart, which, being essentially a “superstructure” above the network schedule, gives us the opportunity to visualize the schedule of our project.
You can learn how to manage project deadlines, apply the network schedule, Gantt chart and other tools at our project management trainings.
Key concepts of this article: scheduling, project schedule (schedule), Gantt chart (Gantt).
Related topics: “Network planning and network schedule”, “Work breakdown structure”.
You can also get acquainted with our proposals for consulting and staff training in the field of project management.
Project planning scheduling is a key and important process, the result of which is a project schedule approved by company management (often referred to as a time schedule , time schedule, project management plan). The purpose of scheduling is to obtain an accurate and complete project schedule taking into account the work, their duration, the necessary resources, which serves as the basis for the execution of the project.
Scheduling includes:

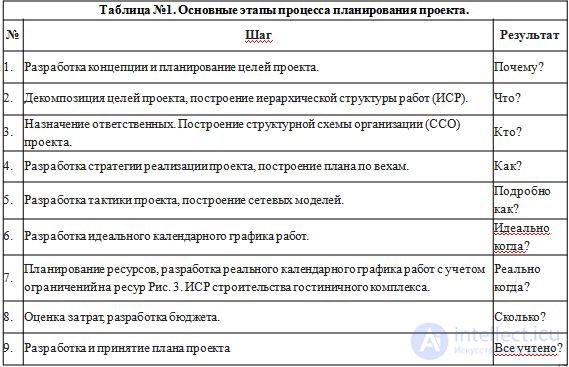
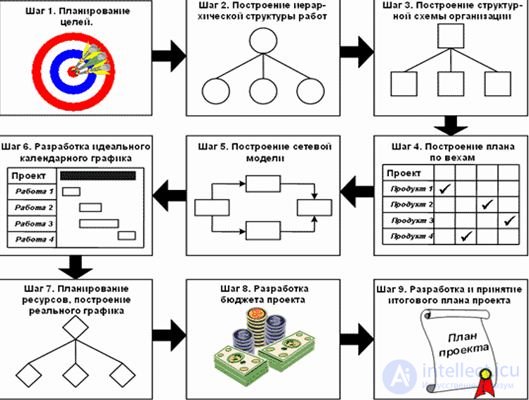
Fig. 1. Algorithm of project planning
Drawing up a schedule of the project includes several aspects. We must plan the terms and duration of work, determine their sequence and interrelations, think about the necessary resources, take into account the cost of these works and resources. Later, when the project moves to the stage of execution, that is, the practical implementation of the planned actions, it is on this schedule that we track the progress of work. And, if something in the project goes wrong, you can, after checking with the original project plan, make the appropriate changes.
As a rule, the project schedule is developed by the project manager with the involvement of people who are experts in a particular field. For example, the construction specialist knows best the construction specialist; and the marketer will most likely plan activities to promote the product. As a result, we get a complete list of works, structured according to a hierarchical basis, that is, structural work decomposition (SDR).
The next step in creating a project schedule is the definition of work durations and their interrelations. For example, some work in our list can be performed strictly sequentially, and some - in parallel with each other in time. In order to “link” the project deadlines, their duration and dependencies, today all over the world project managers use a simple but at the same time useful scheduling tool - the Gantt chart (sometimes a “Gantt chart” is written). The Gantt chart is a visual representation of the project’s schedule, on which the hierarchical list of all project activities (SDRs) is on the left, and the calendar with specific dates on the right. The works are indicated by stripes, the connections between the works are arrows.
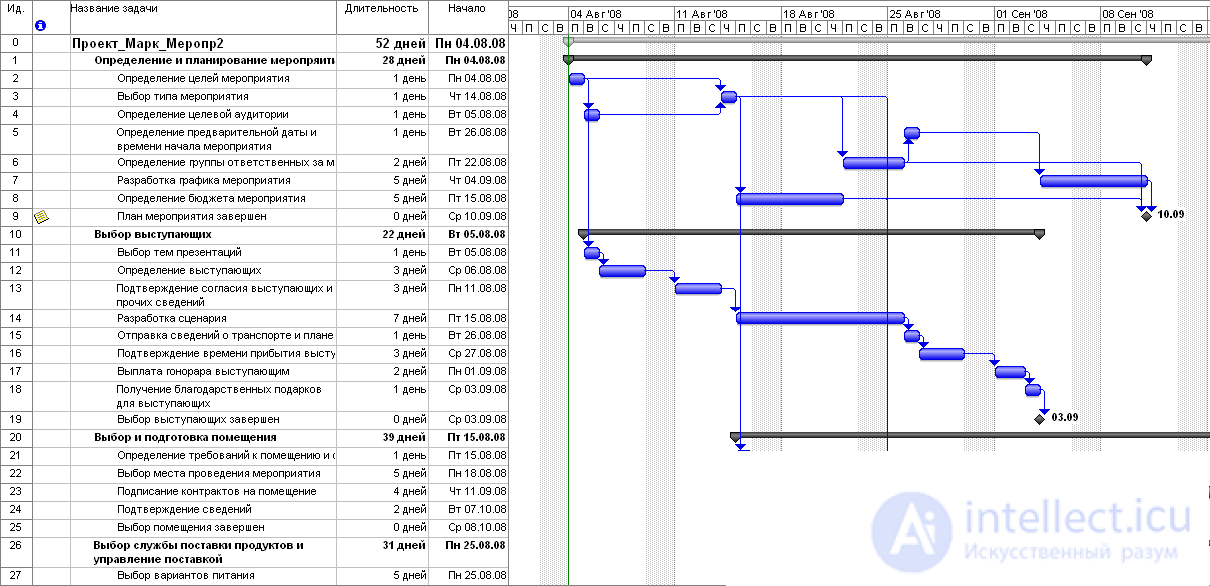
Fig. 2. Gantt Chart
In addition to drawing up a list of activities, scheduling also includes the creation of a project resource model. We need to think about who will perform these or other works or stages of work, what kind of people we need for this, who is responsible for the result of the work or stage. In addition to human resources, projects may require consumables, raw materials, as well as the use of machinery, equipment, transport, etc. All this is resources for a project, and they all have their value. In addition to cost, resources have such characteristics as:
The resource plan of the project can be made in the form of a table:
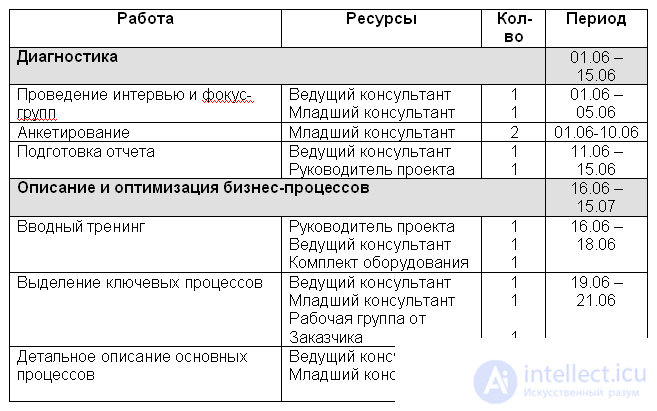
Fig. 3. Resource plan of the project
In specialized software products such as Microsoft Project today, you can easily and quickly build a Gantt chart, assign the necessary resources to each job, determine the time and cost of the project. The time schedule graphically shows the resources and their employment in a particular job.
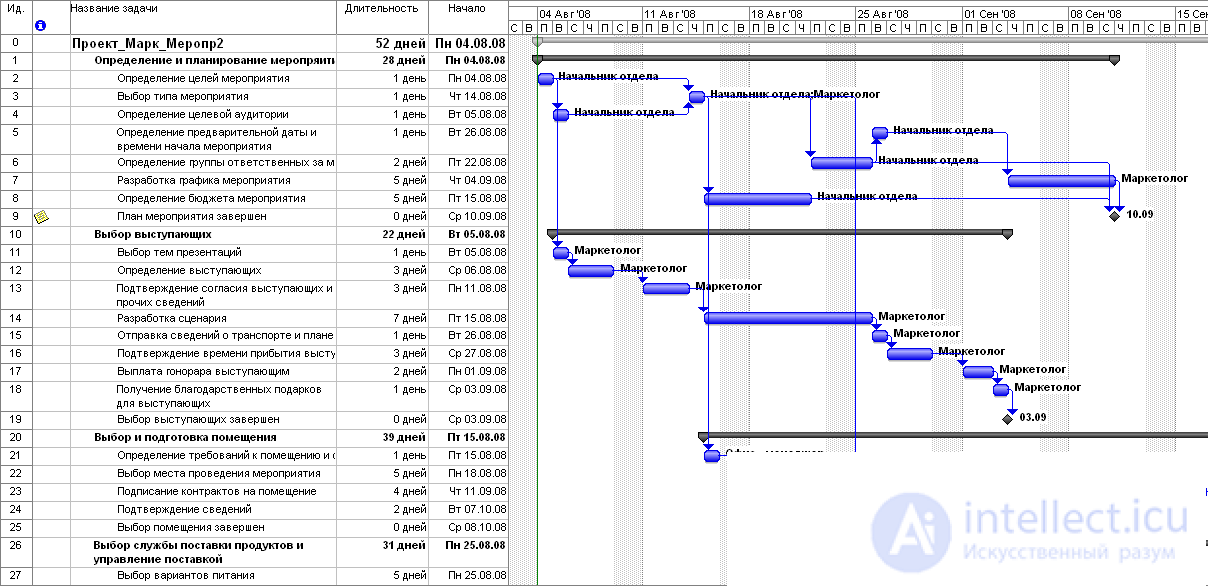
Fig. 4. Gantt chart with assigned resources
Since the cost of any of the resources, be it people, materials or machines, can be measured in monetary terms, then when planning work and assigning resources to it, the cost of certain works, stages and the whole project is considered automatically in the program. When a project enters the execution stage, the project manager and company management will always be able to track the progress, actual work performed or the percentage of their completion, as well as the actual costs of the work, stages and the project as a whole. The use of software products makes it possible to track the execution of a project at any time, to make changes if necessary and to make management decisions. Many people think that planning does not require special time allocation. However, as practice shows, mistakes or negligence in planning can lead a company to significant financial (and not only) losses. “Saving” at the planning stage, one can spend much more time, effort and finances on constantly correcting mistakes, making additional work (not taken into account earlier!), Attracting additional resources (because we do not have time!), Etc. There is such an aphorism: "When we spend time on planning, it becomes more."
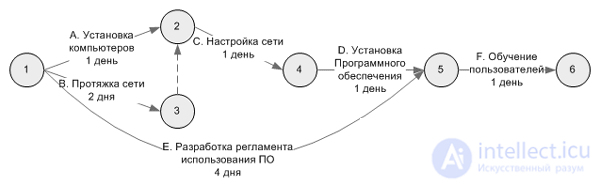
In the network, events are indicated by a circle indicating the number inside the event, and working with an arrow, sequential drawing of works and events means building a network schedule.
Any sequence of activities in the network, in which the final event of one work coincides with the initial event of the next work, etc., is called a path.
When performing successive works, each subsequent work can be started only after receiving the results of all previous works, i.e. after the occurrence of certain events. After building relationships for each work, the time for its performance is determined by an expert, which is put on the network above the corresponding arrow.
In order for a project to be successful, it must have a clearly defined and realistic goal.
The goal of the project is the desired result of the activity achieved within the set time interval.
The formulated goals must comply with the SMART principle, according to which they must be:
Goals should be carefully considered for a number of reasons:
The result of the 1st step (goal planning) is a document containing in its basis the formulation of goals that the project manager must agree with the customer and the main consumers of the project results.
The construction of a hierarchical structure of work (SRI).
After the formulation of the project objectives, a hierarchical work structure (SRI) is built - a consistent multi-level splitting of the goal into works that must be completed in order to achieve the goal.
The following characteristics are used as criteria for the decomposition of the project.

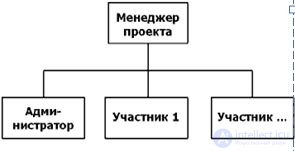
The formed organizational structure of the project and the distribution of responsibility for the work and the reporting system form the structural scheme of the project organization (MTR).
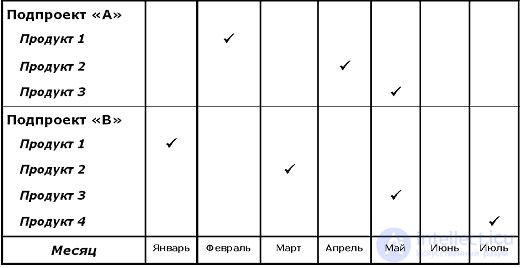
After constructing the hierarchical structure of the work and the structural scheme of the project organization, it is possible to put down and coordinate with the customer the main stages of the project (milestones). It is at these stages that the customer will monitor the progress of the project.
Milestone - event or date during project implementation. The milestone is used to display the state of completion of certain works. In the context of a project, managers use milestones in order to identify important intermediate results to be achieved in the process of project implementation. The sequence of milestones defined by the manager is often called a milestone plan. Dates of achievement of the respective milestones form a schedule for milestones. Thus, at this stage the main reference points are determined, i.e. those results and deadlines that are tightly controlled by the management and which the project manager cannot change without agreement with the customer. An example of building a plan for milestones is given in Figure
After the development of the network model of the project, there comes the stage of building the ideal work schedule, during the construction of which the project manager makes ideal estimates of the duration of their implementation for each work.
Network planning provides managers with a flexible scheduling and analysis tool.
The purpose of this stage is to minimize the time spent on the execution of works by assessing the duration of implementation for each of them.
In determining the ideal estimates of the duration of the work, resource limitations are ignored and only technological limitations and standards are taken into account. The results of determining the duration of the work are introduced into the network model and determine the overall duration of the project.
Having a network model you need to optimize it and reduce the overall duration of the project. This is possible due to:
reduction of the time for performing individual works,
организации их параллельного выполнения,
устранения временных разрывов.
Для выделения работ определяющих минимальную длительность проекта применяется метод критического пути.
Для временной оптимизации сетевой модели необходимо определить именно те работы, которые в действительности определяют его длительность, и отделить их от тех, которые не влияют на суммарное время реализации проекта.
В случае сложных проектов количество работ определяющих его длительность, как правило, составляет небольшую часть (20%) и их выделение позволяет сосредоточить усилия по оптимизации в нужном направлении. Согласно методу критического пути данные работы называют критическими, а их сетевую взаимосвязь (цепочку) — критическим путем.
В процессах оптимизации и управления проектом основное внимание сосред***ачивается на главном направлении, то есть на работах критического пути.
Работы проекта для своего выполнения требуют разнообразных ресурсов. На данном шаге определяется перечень и количество ресурсов, требуемых для выполнения работ проекта. Основой для выполнения этой работы служит разработанная ранее ИСР.
Практический смысл этого шага проектирования состоит в том, чтобы учесть все необходимые ресурсы, правильно оценить и распределить их.
Ресурсами, планируемыми в проекте, являются ресурсы материальные и человеческие. Все они имеют стоимостную оценку, однако ее недостаточно для планирования, важно оценить такие параметры как наличие ресурсов и их доступность, качество, сезонность и многое другое.
Основными типовыми ресурсами проекта являются:
• рабочее время сотрудников (основной персонал проектаи привлеченные специалисты),
• использование техники (имеющейся в собственностии арендуемой),
• новое оборудование,
• материалы — основные и расходные,
• стоимость информации, методик, технологий авторских прав,
• расходы на командировки, связь, аренду помещений и пр.
В процессе планирования ресурсов также определяется организационная политика в отношении ресурсов, например порядок закупок, найма персонала, отношений с поставщиками.
В процессе планирования разрабатывается система требований к ресурсам, например квалификация рабочих, качество металла, сроки транспортировки и т.д.
После определения перечня ресурсов строят матрицу распределения ресурсов по работам проекта, изображенную на Рис 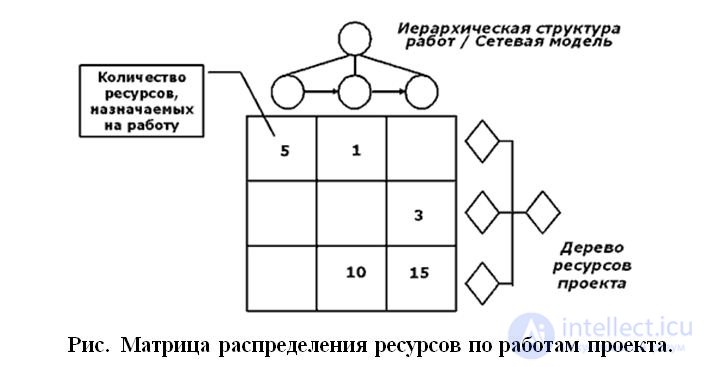
На данном этапе на основе разработанного реального календарного план-графика и разработанной матрицы распределения ресурсов рассчитывается стоимость проекта и анализируется его обеспеченность финансовыми средствами.
При этом должны быть найдены источники, позволяющие обеспечить финансирование всего комплекса работ, необходимого для достижения заданных целей.
В результате должны быть спланированы и рассчитаны по времени и объему денежные потоки в соответствии с планируемым объемом работ.
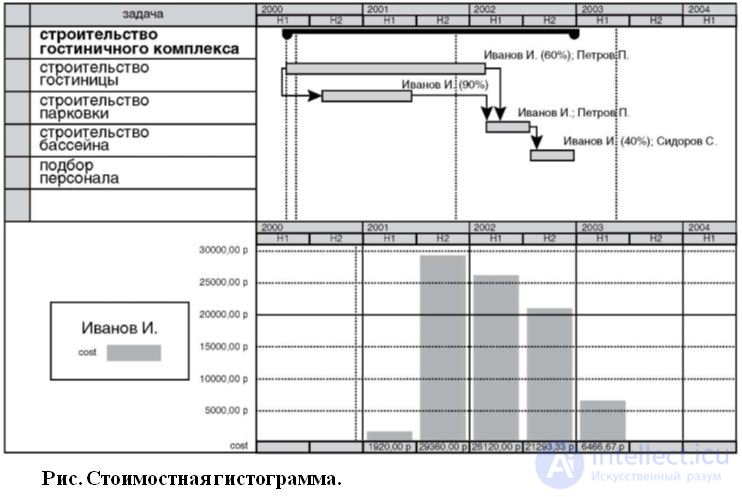
Результатом данного этапа является разработанный бюджет проекта и соответствующая стоимостная гистограмма - Рисунке
В случае если проект имеет доходы, разрабатывается бюджет доходов и расходов.
Для больших проектов, в особенности финансируемых за счет внешних источников, необходимо разработать бюджет движения денежных средств - БДДС.
На основе анализа финансовых бюджетов БДР и БДДС может быть произведена корректировка календарного план-графика, в том числе произведен отказ от реализации проекта.
Результаты планирования проекта должны быть задокументированы и представлены для утверждения.
Разработка, документирование и согласование плана проекта направлены на достижение следующих основных целей:
• обеспечение понимания и одобрения целей проекта и средств их достижения;
• обеспечение назначения требуемых ресурсов (времени, денег, штата) на проект;
• обеспечение основания для оценки и отображения прогресса достижения целей и результатов проекта;
• обеспечение основания для контроля внедрения изменений.
Задокументированные результаты реализации предыдущих шагов планирования ложатся в основу итогового плана.
В общем случае в итоговый план включаются дополнительные разделы:
• предистория инициации проекта;
• ссылки на внешние документы;
• документы, регламентирующие порядок взаимодействия
участников проекта, подготовку и анализ;
• проектной отчетности и пр.;
• ограничения, риски и неопределенности проекта;
• процесс решения проблем.
Информация, содержащаяся в итоговом плане, должна быть представлена в форме, удобной для рассмотрения руководством организации и участниками проекта.
Любые вопросы, требующие дальнейших исследований, по возможности должны быть решены до утверждения плана.
Руководство должно согласиться и одобрить соглашения по ресурсам, вехам и ключевым рискам проекта, а также процедурам управления рисками. Любые согласованные изменения должны быть задокументированы.
Возможно два подхода к построению сетевых моделей. При первом - стрелками на графике изображаются работы, а вершинами - события. Такие модели относят к типу "Работа-стрелка" и называют сетевыми графиками
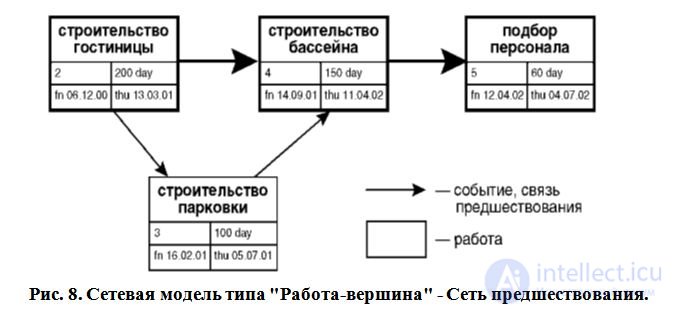
При втором подходе, наоборот, стрелкам соответствуют события, а вершинам - работы. Такие модели относят к типу "Работа-вершина" и называют сетями предшествования. На рисунках показаны примеры данных типов моделей.
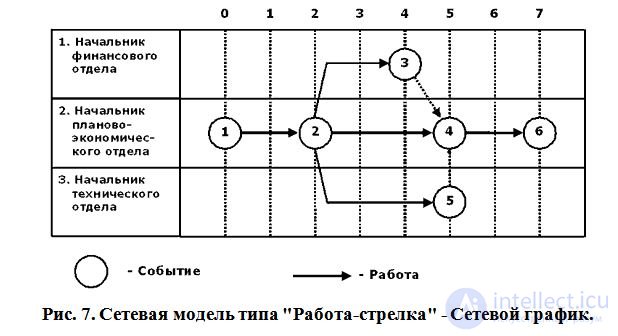
Работами являются любые действия, приводящие к достижению определенных результатов - событий. События, кроме исходного, являются результатами выполнения работ. Между двумя смежными событиями может выполняться только одна работа или последовательность работ.
Для построения сетевых моделей необходимо определить логические взаимосвязи между работами. Причиной взаимосвязей являются, как правило, технологические ограничения (начало одних работ зависит от завершения других). Комплекс взаимосвязей между работами определяет последовательность выполнения работ во времени.
Для определения последовательности необходима следующая информация: перечень работ, описание продукта, технологические, дискретные и внешние взаимосвязи, ограничения и предположения
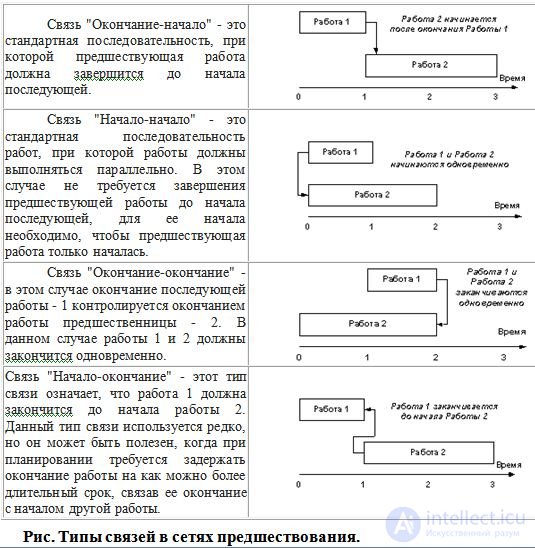
В сетях предшествования события обозначаются стрелкой, а работа блоком, форма которого может быть произвольной и зависит от используемых программных средств.
Для описания зависимостей между работами в сетях предшествования может использоваться четыре типа связей, приведенных на рисунке
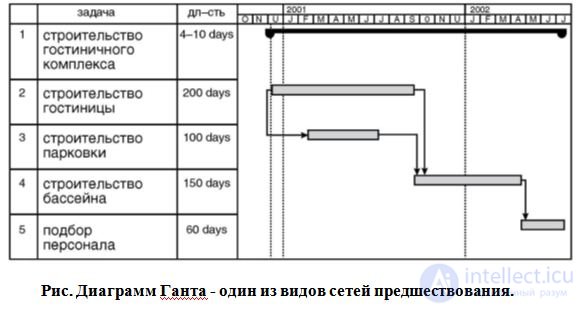
В современных программных продуктах управления проектами преимущественно используются сети предшествования, так их программная реализация более проста. В качестве примера можно привести один из видов сетей предшествования - диаграмму Ганта, применяемую во многих программных средствах и изображенную на рисунке
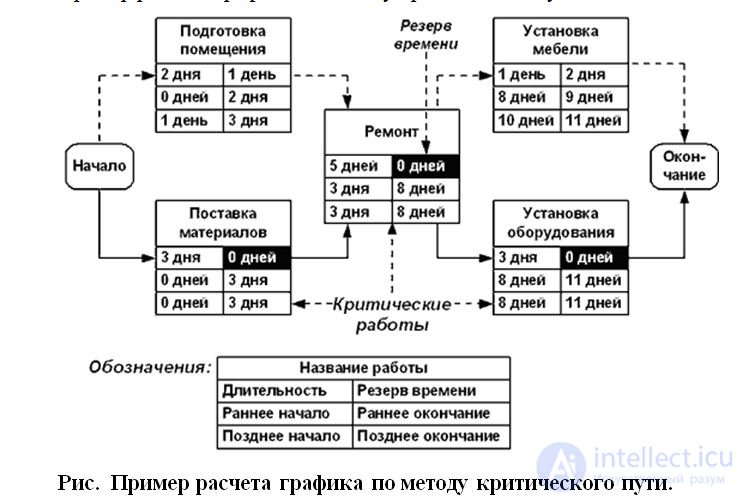
Критический путь — это наиболее протяженная по времени цепочка работ, ведущая от исходного к завершающему событию.
Изменение продолжительности любой работы, лежащей на критическом пути, соответственным образом меняет (сокращает или удлиняет) срок наступления завершающего события, т.е. дату завершения проекта, поскольку работы, лежащие на критическом пути не имеют резерва времени.
Все работы, которые лежат вне критического пути, имеют резерв времени, на которое может быть отсрочено наступление завершения данной работы без нарушения сроков проекта в целом. Резерв времени работы определяется как разность между поздним и ранним сроками завершения работы.
Ранний из возможных сроков наступления окончания работы — это срок, необходимый для выполнения всех работ, предшествующих данной. Поздний из допустимых сроков — это такой промежуток времени, на который может быть отсрочено наступление окончания данной работы без нарушения сроков проекта в целом.
Пример критического пути приведен на Рисунке

Методика определения критического пути.
Для определения критического пути производится процедура прямого и обратного прохода по сетевому графику и вычисляется выходная информация.
Прямой проход начинается с начальной даты проекта и продолжается по сетевому графику, при этом для каждой работы к начальному сроку прибавляется ее продолжительность и вычисляется раннее начало и раннее окончание этой работы. Самыми ранними возможными датами для работы являются ее начало и конец, допустимые исходя из логической последовательности сетевого графика.
Обратный проход использует в качестве исходной точки конечную дату расписания, вычисленную путем прямого прохода, и проводится обратный расчет для определения поздних дат начала и окончания работ. Поздними датами работы являются ее самые поздние допустимые начало и конец, не влекущие задержки выполнения всего проекта. Кроме того, на основании рассчитанных ранних и поздних дат начала работ определяются величины временных резервов для каждой работы.
Все работы, которые лежат вне критического пути, имеют резерв времени на которое может быть отсрочено наступление завершения данной работы без нарушения сроков проекта в целом. Резерв времени работы определяется как разность между поздним и ранним сроками завершения работы.
Ранний из возможных сроков наступления окончания работы - это срок, необходимый для выполнения всех работ, предшествующих данной. Поздний из допустимых сроков - это такой промежуток времени, на который может быть отсрочено наступление окончания данной работы без нарушения сроков проекта в целом.
При планировании вводят два основных типа ресурсов: возобновляемые и невозобновляемые.
К типу возобновляемых относят ресурсы, которые в ходе работы сохраняют свою натурально-вещественную форму и по мере высвобождения могут использоваться в других работах. Если возобновляемые ресурсы простаивают, то их недоиспользованная способность к функционированию в данный отрезок времени не компенсируется в будущем. Примерами ресурсов данного типа являются люди, машины, механизмы, станки и т.п.
К типу невозобновляемых относят ресурсы, которые не могут повторно использоваться. Но в случае если они не были использованные в данный отрезок времени, то их недоиспользованная способность к функционированию компенсируется их использованием в будущем. Примерами ресурсов данного типа являются топливо, финансовые ресурсы и т.п.
После построения матрицы распределения ресурсов по работам строится профиль доступности ресурсов, который показан на Рис. При помощи профиля доступности ресурсов, показывают наличие ресурсов в каждый момент времени реализации проекта. 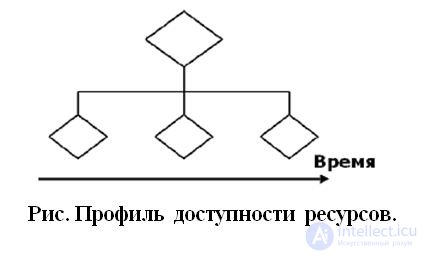
После построения профиля доступности строят ресурсные гистограммы, показывающие перегрузку / недогрузку ресурсов - Рис. 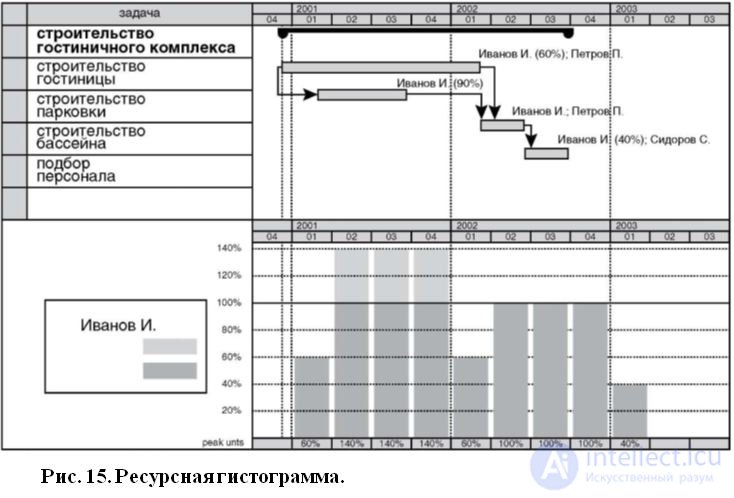
Перегрузка отдельных работников, как показано на рис. также является основанием для корректировки календарного плана в сторону увеличения времени производства работ.
Таким образом, разработанный профиль доступности ресурсов задает ограничения, которые приводят к дальнейшей оптимизации идеального календарного план-графика проекта.
Процедуру дальнейшей оптимизации называют выравниванием ресурсов и при ее реализации используют следующие приемы:
разнесение параллельных задач (приводит к увеличению времени проекта);
увеличение длительности задач (приводит к увеличению времени проекта);
разрыв задач (приводит к увеличению времени проекта);
назначение дополнительных ресурсов и / или изменение их профиля (приводит к увеличению стоимости проекта);
смешанный подход (приводит к увеличению времени и стоимости проекта).
Во всех вариантах выравнивания происходит либо увеличение времени, либо увеличение стоимости проекта.
В общем случае существует соотношение неопределенностей между основными показателями проекта: временем, стоимостью и качеством. При улучшении одного параметра, всегда ухудшаются два других. Основной задачей менеджера при оптимизации плана проекта является поиск оптимального баланса между тремя показателями.
После оптимизации идеального календарного план-графика проекта с учетом ограничений на ресурсы разрабатывается реальный план проекта
План-график обеспечивает эффективное взаимодействие и координацию всех элементов проекта, что позволяет:
The budget is a broader concept than estimates. The budget is a dynamic form of management reporting and provides for not only the expenditure part, but also the movement of funds, income received during the implementation of the project. It can and should be adjusted even during budget periods (Month, quarter, year). Budget reporting forms allow for the current express analysis of deviations from planned indicators of income and expenses.
The estimate is a static form of reporting, it is ideally suited for planning fixed costs of the enterprise and drawing up a report on them, and is practically inapplicable for the current calculation and adjustment of conditionally variable costs.
Project management has a definite purpose and reasons confirming the existence of this relatively new management method and has a twofold goal:
- ensure that programs and projects, when initially reviewed and approved, take into account possible acceptable risks in relation to the main objectives: technical, costly and temporary;
- effectively plan, control and conduct each project simultaneously with all other programs and projects so that, as a result of their implementation, the intended goals are achieved: obtaining certain results in accordance with the schedule and within the planned budget.
Projects give rise to the need for change, and project management provides a mechanism for the adaptation of organizations — the adaptation that is necessary for the sustenance and growth of complex human-made enterprises.
By now, project management has become an investment methodology recognized in all developed countries. However, project management has become a truly independent discipline thanks to the knowledge gained from the study of the general patterns inherent in projects in all areas of activity, as well as methods and tools successfully used for various projects.
Thus, scheduling is an iterative process that allows you to simulate a project and get in the end the best option for the project calendar schedule with optimal deadlines. And remember: well-planned - half done!

Comments
To leave a comment
System modeling
Terms: System modeling