Lecture
The use of simulation modeling to optimize business processes is a kind of magic wand for top management. It allows you to determine how the transformation will affect the company, putting experiments not on a "live" organization, but on its model. Tempting? For more detailed instructions, read this article.
The company's activities need to be optimized ... For some managers, "optimization" is an order lowered from above, for others - an urgent need, a project, the result of which depends on the further fate of the company. Anyway, the top managers of the company or external consultants proceed with the analysis and optimization of activities. Considering that absolutely any parameter can be an object of optimization: operators who receive calls, the number of clients served or the product being produced, ideas for improvement can be completely different: from the liquidation of a department to the introduction of new technologies. Understanding which idea is the most advantageous is difficult. And conducting experiments on a real company is too expensive.
To build the right business, without experimenting with the company and employees, allows simulation modeling, which this article is devoted to.
Simulation modeling is a research method based on the fact that the system under study is replaced by a model that simulates this system. Experiments are conducted on the model and, as a result, they receive information about the real system. Simulation modeling of business processes is widely used in projects for the reengineering of companies, when it is necessary to predict the results in advance.
The indicators that are optimized in the first place are:
Unsatisfactory values of these indicators inevitably reduce the efficiency of the process, which leads to loss of funds of the company and dissatisfaction of the manager. Why these indicators stand out as the main? The high cost of the process directly increases the costs of the company. A long process of execution increases the likelihood that its result will be obtained at the wrong time and by that time no one may need it. An insufficient amount of the product of the process - comment, perhaps, is not even required.
The simulation method allows us to estimate the time of the process and the time spent on delays during the process, for example: the operator went to lunch or the inventory items (TMC) did not fly up in time. Also, the method allows to estimate the amount of product obtained for a certain observation interval.
To determine the cost of the process, together with simulation modeling, it is advisable to carry out a functional cost analysis (FSA). FCA is a method of calculating the cost of a product, which differs from the traditional one in that it focuses on calculating the cost of the processes necessary to produce a product or providing a service, rather than dividing costs into direct and indirect and grouping these costs into costing items. The basis of the FSA is that there are a number of processes for the production of a product that require resources. The cost of the process is calculated by transferring the cost of resources to the cost of each step of the process. The sum of the costs of all the steps of the process is the cost of the product.
Simulation involves four main steps:
The simulation method allows you to simulate the process as it would occur in reality, but in the mode of accelerated time. Let's look at how processes are performed in life. A rare process is performed clearly and quickly. Almost always there are breaks and delays associated with the fact that a higher priority is being received, the necessary employees are busy or the components have not been ordered in time. There are many examples of such processes; we will cite only some of them:
To mimic the diversity of such situations, it is necessary to consider a number of factors:
Adding to these factors a description of business processes, we get a model on which to conduct experiments and get answers to our questions.
Consider preparing a business process for imitation.
The first thing that needs to be done is to highlight the event that is the signal to start the process - the start event of the process. For example, the signal to start the process of "Preparing a commercial offer" is the event "A request for a commercial offer has been received from a client". The launch event can occur with different frequency, for example, calls from customers arrive every 10-20 minutes, it is necessary to carry out a routine check of the equipment’s operation once every 2-3 months, and the director’s meeting is held every Friday and begins exactly at 9 am. It is obvious that some of the events occur at certain points in time, some - at intervals. Moreover, the moment of time and the interval between repetitions of events can be random variables for which the laws of their occurrence are indicated.
For each step of the process, you must specify the duration, which can be a constant or a random variable. For example, the duration of the "Part grinding" step performed by a CNC machine is exactly 5 minutes. But if the machine performs a step in a fixed time, then, as soon as it comes to people, it is impossible not to take into account that people have complex and unpredictable behavior. It may take 5 minutes for one performer to perform a seemingly simple step “Entering information about a client’s request into the Information System”, and another 20 minutes. In addition, the step execution time may be a random value for objective reasons. The process "Answer a customer call" can take from 1 to 30 minutes depending on the customer and the purpose of his call.
When describing a business process, it is important to pay attention to the fact that this is not always a linear sequence of steps. Often the choice of the next step depends on a number of conditions, such as "Current date", "Number of already processed blanks". Or the choice of a further step is probabilistic in nature, for example, the probability that a standard contract passes the client approval procedure is 0.7, and the probability that the client sends comments to the text of the agreement is 0.3.
In order to evaluate the cost of the process as a result of the simulation, for each step, it is necessary to specify a list and cost of resources used in its implementation. All resources, depending on the logic of transferring the cost of the process are divided into 2 groups: labor and material. Labor resources are resources whose cost of use depends on the time they are used in the process. A striking example of a labor resource is an employee. The cost of material resources does not depend on the time of their use and is transferred to the cost of the process step immediately. The cost of a unit of material resource is given as a fixed value. The cost per unit work time of a labor resource may depend on the shift in which the labor resource is used.
For example, to complete the step “Car assembly” a material resource “Component product” and labor “Worker” are necessary. The cost of the component is 1000 rubles. The cost of a worker is 100 rubles (on the day shift) or 120 rubles (on the night shift). If the car is assembled within 4 hours, with 2 hours per day shift and 2 hours per night shift, then the cost of using the Worker resource will be 440 rubles. Accordingly, the total cost of resources that will be transferred to the cost of the process step is 1,440 rubles.
If during imitation there is a task to optimize stocks of inventory items, then for processes it is necessary to indicate not only resources, but also products that appear in the warehouse as a result of their implementation.
Having designed and configured a process model, you can run an imitation. Since the time parameters of the processes and the time of occurrence of events are random variables, one experiment with the model will give only one option for the development of the process. Based on a multitude of measurement repeats, more accurate estimates of indicators can be obtained. It is advisable to carry out imitation for the entire period, the analyst of interest, for example, for the quarter.
Thus, as a result of carrying out imitation, we obtain distributions of values of the cost and time of the process, and not only the useful time of the process, but also the time spent waiting for the necessary amount or availability of material or temporary resources.
But the mechanism of simulation can provide interesting information not only about the implementation of business processes, because it also simulates the workforce and the production and consumption of material. As a result, you can:
Identify "bottlenecks" among the workforce - overloaded resources, to which a queue of tasks (process steps) is constantly built, as a result of which they delay the implementation of all processes.
Identify labor resources with low load.
Analyze the production and consumption of material resources and determine whether there is a problem of shortage or overproduction of resources. The shortage leads to an increase in the process execution time, and overproduction or the purchase of resources in quantities exceeding the requirements entails costs for stocks.
If, as a result of the analysis, the obtained values of the process indicators turned out to be unsatisfactory, the model can be changed in accordance with the following idea of optimization and imitation can be performed again. According to the results of all experiments, you can choose the option with the most optimal values of the indicators. At the same time, I would like to note once again that conducting experiments does not stop the work of the entire enterprise and does not violate the current performance of operations.
The simulation method and functional cost analysis are also useful if you need to design a new business. What should be the organizational structure of this business? How often should processes be performed? What is the optimal duration and cost of processes? All these questions can be answered BEFORE the company starts working and finds out that the workforce is overloaded and material resources are constantly lacking. Of course, you can first create a company, organize its work according to the “how it goes” principle, make sure that the attempt was unsuccessful, and only then proceed to solving the problem of optimizing activity. But if you design the right, efficiently working business right away, many problems simply do not arise, which will save valuable time that can be spent on developing a young company.
Along with many advantages of the method of simulation of processes, there are a number of minuses. It is impossible not to note the fact that to obtain valid results, work is needed to determine the laws of the distribution of random variables and careful work on entering all the data to carry out imitation. The well-known expression most clearly characterizes this situation. In addition, simulation modeling itself does not provide answers to questions about whether the system is working effectively, whether the values of the indicators are optimal and how to restructure the business process. This requires a business analyst. But only with the help of simulation mechanisms and functional cost analysis in some cases can a business analyst quickly obtain and process the valuable information that a manager absolutely needs to make important management decisions. Moreover, the manager will be able to make these decisions based on a comparison of the values of key indicators, and not believing the consultants to take the floor.
We continue the series of articles devoted to the simulation method for optimizing business processes. The theoretical basis for the application of this method was given in the article “Simulation modeling: optimizing business processes”. This article will consider an example of a decision to optimize the work of the warehouse on the basis of data obtained as a result of the simulation.
A modern warehouse is a complex system, during the coordinated work of which reception, storage, processing and distribution of goods among consumers are carried out. This article will analyze the following operations performed by warehouse workers:
As an example, consider a small warehouse. For servicing vehicles in a warehouse, there are two unloading posts, two brigades (each consisting of a mechanic, a loader and a loader) and two additional parking spaces for trucks in the warehouse. The warehouse owner is planning to increase the freight traffic. Anticipating the problem of the chaotic arrival of vehicles to the warehouse and, as a result, an increase in vehicle downtime and uneven loading of warehouse personnel, he agrees with suppliers about a specific time for the truck to arrive at the warehouse, distributing the moments of vehicle arrival more or less rhythmically during the day. At first glance, everything is provided. Even in the case of late arrival of one or two trucks, they will be able to wait for service in the warehouse parking area. With the help of simulation we try to check whether this statement is true.
A simplified model of the process “Implementation of unloading operations” in the EPC notation is presented in Fig. 1 .
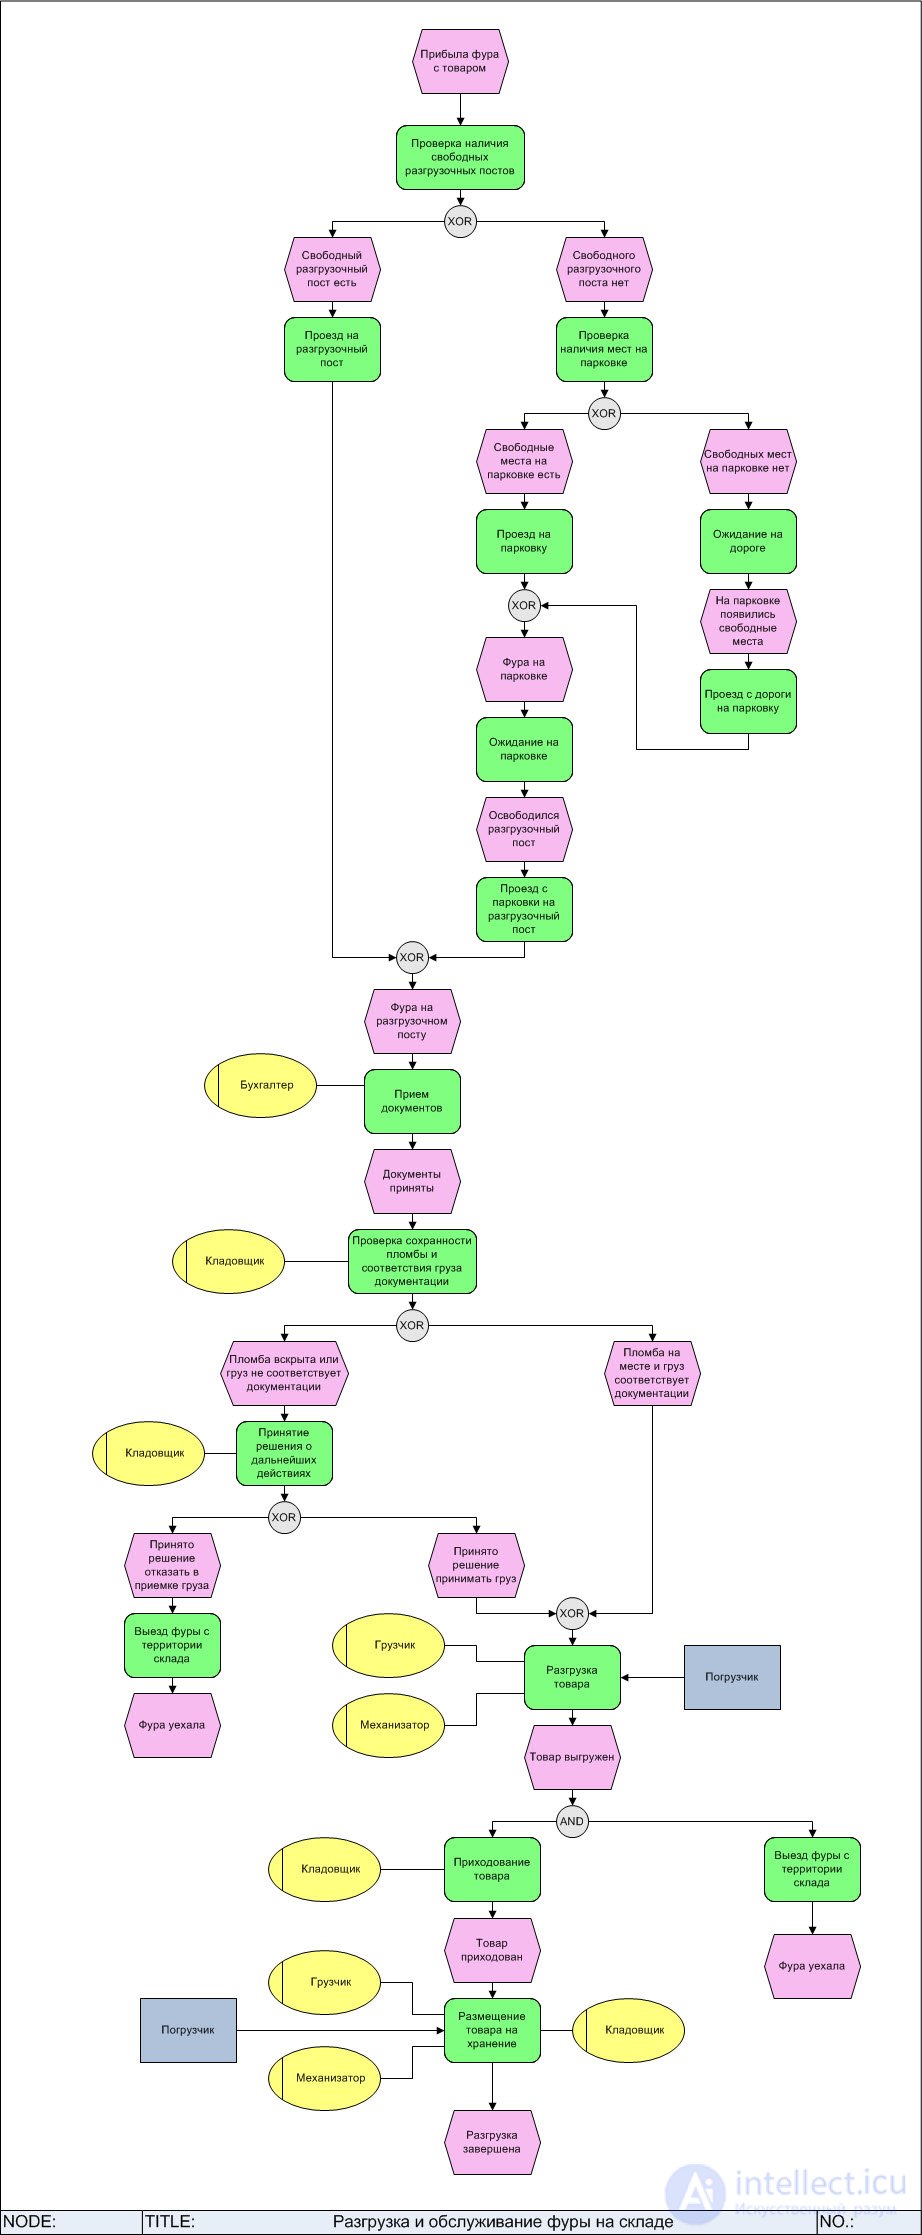
Fig. 1 - Process diagram “Unloading and maintenance of the truck in stock”
The purpose of the study is to determine whether the warehouse, in its current configuration, will be able to cope with the increased traffic flow. To simulate the work of the warehouse, we will use the Business Studio business modeling system.
Considered as an example, the warehouse accepts trucks from 9:00 to 15:00. Wagons arriving later are not served this day. The standard interval between the arrival of trucks is 30 minutes by negotiating with suppliers. But, taking into account all the difficulty of predicting the exact time during which the truck will be on its way to the warehouse, the wagons can drive up as before, and later. Therefore, to simulate the interval between the arrival of trucks, we will use the normal law with a expectation of 30 minutes and a possible range of values from 5 minutes to 1 hour ( Fig. 2 ). This law can be called pseudonormal, since It has a clear boundaries of values of a random variable.
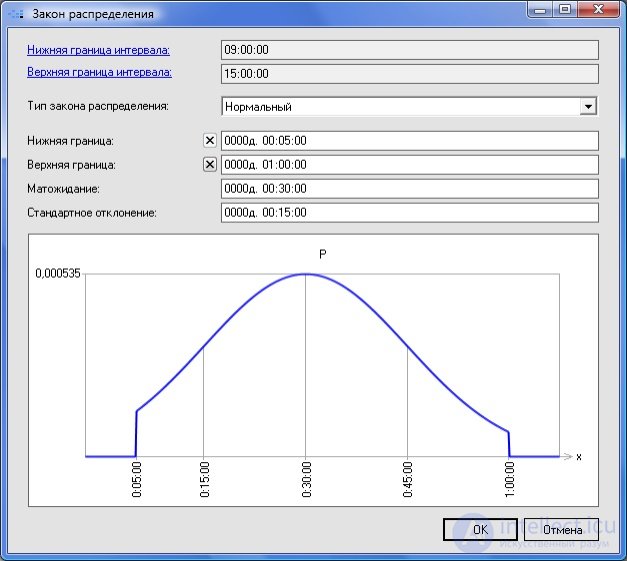
Fig. 2 - The distribution of the interval between the arrivals of trucks
The number of unloaded trucks directly depends not only on the unloading time of one truck, but also on the execution time of each step of the business process. The execution time of a process step can be fixed or random. The steps of the process of “unloading and servicing a truck in stock” are given in Table 1 .
Tab. 1. The duration of the process steps
| Process step | Duration |
| Check for free unloading posts | 1 minute |
| Directions to the unloading post | 5 minutes |
| Checking the availability of parking spaces | 1 minute |
| Drive to the parking | 3 minutes |
| Waiting in the parking lot | 0 (time is modeled by the system automatically) |
| Directions from parking to unloading post | 4 minutes |
| Waiting on the road | 0 (time is modeled by the system automatically) |
| Driving from the road to the parking lot | 3 minutes |
| Reception of documents | 10 minutes |
| Checking the integrity of the seal and consistency of cargo documentation | Uniform distribution law: - lower bound - 10 minutes - upper bound - 20 minutes |
| Decision on further action | Uniform distribution law: - lower bound - 20 minutes - upper bound - 1 hour |
| Departure of the truck from the warehouse | 5 minutes |
| Unloading goods | Normal distribution law: - lower limit - 20 minutes - upper limit - 1 hour - expectation - 40 minutes - standard deviation - 10 minutes |
| Coming of goods | Normal distribution law: - lower limit - 10 minutes - upper limit - 40 minutes - expected value - 15 minutes - standard deviation - 5 minutes |
| Placement of goods for storage | Normal distribution law: - lower limit - 30 minutes - upper limit - 2 hours - expected value - 1 hour - standard deviation - 15 minutes |
| Departure of the truck from the warehouse | 5 minutes |
The duration of the process step depends not only on the standard time of its execution, but also on the availability of resources (temporary and material) necessary for its implementation. If the necessary resources are not available at the right time, the process stops. The steps for servicing the truck in the warehouse are performed by the warehouse staff, attracting, if necessary, appropriate equipment. The list and number of resources required to perform each step of the process are given in Table 2 .
Tab. 2. The duration of the process steps
| Process step | Resources | Number of resources |
| Reception of documents | Accountant | one |
| Checking the integrity of the seal and consistency of cargo documentation | Storekeeper | one |
| Decision on further action | Storekeeper | one |
| Unloading goods | Loader | one |
| Mechanic | one | |
| Loader | one | |
| Coming of goods | Storekeeper | one |
| Placement of goods for storage | Loader | one |
| Storekeeper | one | |
| Mechanic | one | |
| Loader | one |
The following resources work in total in the warehouse: personnel and equipment ( Table 3 ):
Tab. 3. Temporary resources
| Resources | Number of resources |
| Accountant | one |
| Loader | 2 |
| Storekeeper | 2 |
| Mechanic | 2 |
| Loader | 2 |
The listed resources are temporary, i.e. the cost of their use depends on the time during which they are used. These resources can be used only in the hours set for them as workers. Loaders, for example, are ready to work 24 hours a day, and warehouse employees only work from 9:00 to 17:00 ( Fig. 3 ).
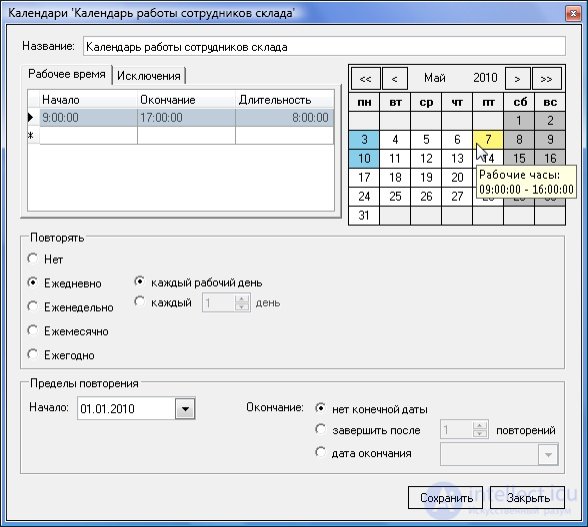
Fig. 3 - Warehouse staffing schedule
Note: Working and non-working days in the calendar are displayed in different colors:
Also, the entire process uses the resources presented in Table 4 .
Tab. 4. Material resources
| Resources | Number of resources |
| Parking space | 2 |
| Unloading post | 2 |
These resources in Business Studio are modeled as material resources: their number decreases when the wagon takes a place (post), and increases when the wagon leaves it. If all the places (posts) are over (number = 0), then the process goes into standby mode until the desired place (post) appears.
Imitation of the work of the warehouse during one working day allows to obtain process indicators ( Fig. 4 ):
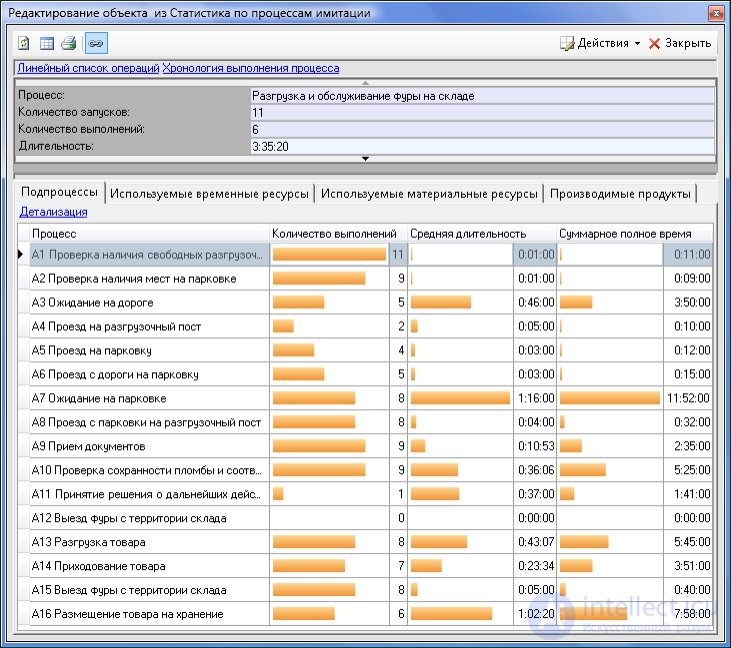
Fig. 4 - Parameters of process steps resulting from the simulation
Analyzing the results of the simulation, we can draw the following conclusion: the existing capacity of the warehouse is not enough to service the increased cargo traffic:
As a result, trucks wait for a long time to be serviced, taking up not only parking spaces and obstructing movement in the warehouse, but also standing idle on the road outside the warehouse, causing discontent among road users and traffic police officers.
The solution to the current situation may be:
In addition, analyzing the use of time resources in the existing conditions, you can see that the bottleneck (the resource whose waiting time during the execution of the process is the greatest) is the Storekeeper ( Fig. 5 ).
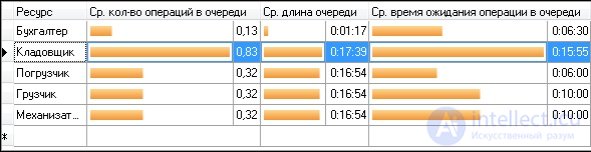
Fig. 5 - Parameters of waiting time resources
To increase the capacity of the warehouse during further experiments, we will increase the number of storekeepers to 3.
We will consider successively each of the proposed solutions.
Simulating process execution with parameters modified in accordance with the first solution gives the following results ( Fig. 6 ):
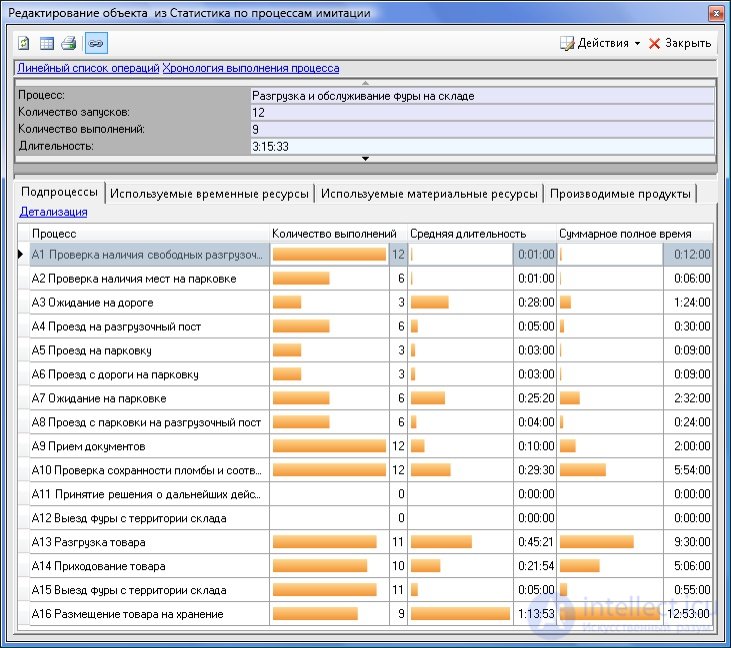
Fig. 6 - Parameters of the warehouse with an increased number of unloading posts
The performance of the warehouse has improved significantly:
Однако нельзя не заметить, что размещен на хранение был только товар, привезенный 9 фурами. Очевидно, что оставлять недоделанную работу на следующий рабочий день нецелесообразно, учитывая интенсивность ежедневного потока поступления фур на склад. Поэтому изменим рабочее время сотрудников склада на график: с 9:30 до 19:00. Смещение начала рабочего дня с 9:00 на 9:30 обусловлено низкой вероятностью прибытия фуры в этот период. Учитывая, что в течение рабочего дня у каждого сотрудника есть время простоя ( Рис. 7 ), увеличение рабочего времени на 1,5 часа не будет сильно утомительным.
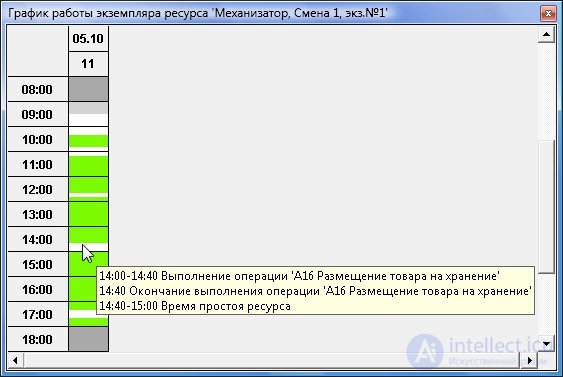
Fig. 7 — График загрузки экземпляра ресурса «Механизатор»
В результате имитации работы склада в этом случае получаем, что из 12 подъехавших фур сотрудники склада успевают не только разгрузить все 12 фур, но и разместить весь доставленный товар на складе.
Имитация выполнения процесса с параметрами, измененными в соответствии со вторым решением, дает следующие результаты ( Рис. 8 ):
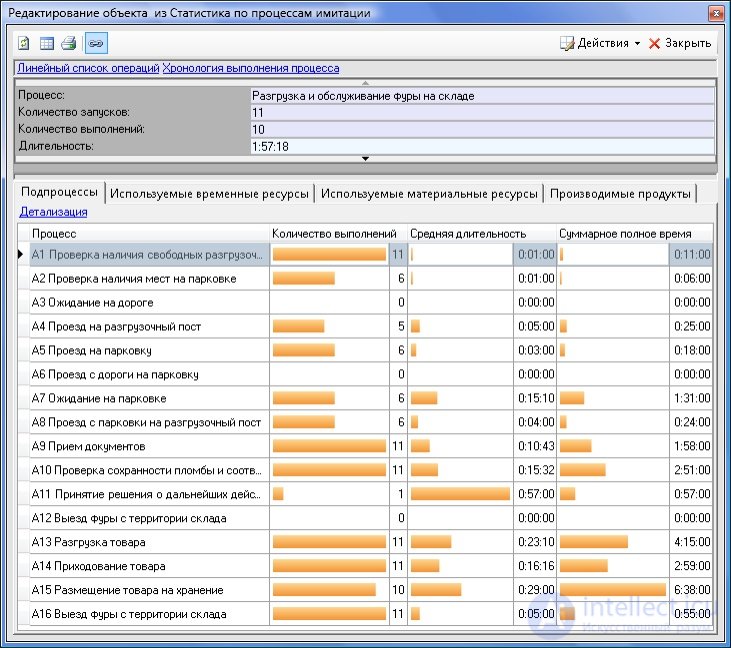
Fig. 8 — Параметры работы склада с увеличенным количеством бригад, обслуживающих пост
Практически идеальные результаты:
омрачает только тот факт, что бригады не успевают разместить на хранение груз, привезенной одной из фур. Изменение времени работы сотрудников склада на график с 9:30 до 17:30 (без увеличения количества часов) позволяет решить и эту проблему.
При этом процент загрузки временных ресурсов — более 50% ( Рис. 9 ), т.е. ресурсы простаивают не так много времени.
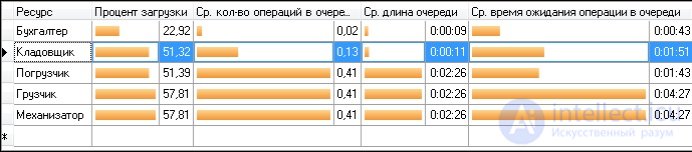
Fig. 9 — Процент загрузки временных ресурсов
Исследования показали, оба решения, позволяют снять проблему очередей транспортных средств. Очевидно, что следующий аспект, который будет интересовать владельца склада — это стоимость внедрения этих решений.
Увеличение количества бригад, в первую очередь, подразумевает найм на работу дополнительных сотрудников, т.е. увеличение переменных затрат. Переоборудование парковочного места в разгрузочных пост влечет за собой не только рост переменных затрат (добавление дополнительной бригады), но и капитальные затраты на переоборудование.
Затраты при реализации каждого решения за 5-летний срок работы склада приведены в Табл.5 .
Примечание: Расходы на единицу ресурса (бригада, кладовщик) в первом случае выше, чем во втором. Это связано с тем, что при реализации первой идеи рабочее время сотрудников склада было увеличено на 1,5 часа.
Табл. 5. Затраты на реализацию решений
| Расходы на содержание в месяц, руб. | Дополнительно необходимое количество | Затраты за 5 лет, руб. | |
| Option 1: Increase the number of unloading posts | |||
| Staff costs: | |||
| Brigade | 44,000 | one | 2 640 000 |
| Storekeeper | 22,000 | one | 1,320,000 |
| Capital expenditures: | |||
| Loader | 100,000 | one | 100,000 |
| Equipment unloading ramp for 1 additional post | 400,000 | 400,000 | |
| Total for 5 years | 4,460,000 | ||
| Option 2: Increasing the number of brigades serving the post | |||
| Maintenance costs per month, rub. | Additionally required amount | Costs for 5 years, rub. | |
| Staff costs: | |||
| Brigade | 40,000 | 2 | 4,800,000 |
| Storekeeper | 20,000 | one | 1,200,000 |
| Capital expenditures: | |||
| Loader | 100,000 | 2 | 200,000 |
| Total for 5 years | 6,200,000 | ||
Имитация работы склада в различных условиях позволила предусмотреть возникновение возможных проблем и проверить работоспособность идей по их решению ДО непосредственного изменения работы склада. Обе идеи позволяют оптимизировать деятельность склада. При сравнении затрат на реализацию идей нельзя не заметить выгодность первого варианта. Но по таким показателям как «Время ожидания фуры на парковке», «Время ожидания фуры на дороге», «Средняя длительность процесса», второй вариант вырывается вперед. Какой из рассмотренных вариантов решения проблемы выберет владелец склада — решать ему. Метод имитационного моделирования предоставил для принятия этого решения все необходимые данные.
Pages:

Comments
To leave a comment
System modeling
Terms: System modeling