Lecture
This method of modeling dynamic systems is based on the fact that harmonic components are present in any signal. Depending on the frequency, the components are called harmonics (the first, second, and so on). The sum of the harmonics with the corresponding weights is the signal model.
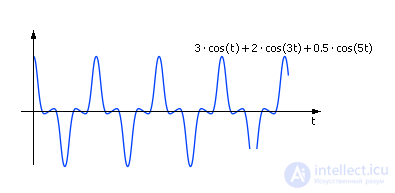
Let, for example, in some signal there is a sum of three harmonics: 3 · cos ( t ) + 2 · cos (3 t ) + 0.5 · cos (5 t ). This means that the signal contains the first harmonic with amplitude 3, the third harmonic with amplitude 2, the fifth harmonic with amplitude 0.5. The total signal itself looks as shown in Fig. 7.1.
| |
| Fig. 7.1. Example harmonic signal |
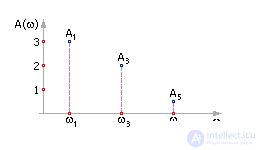
The spectrum of this signal is shown in fig. 7.2. It is clear that in our example the first harmonic has the greatest weight (amplitude) in the signal (more than the others are represented), the fifth harmonic has the least weight.
| |
| Fig. 7.2. Example of harmonic spectrum |
Any signal, no matter how complex it may be, can be represented by a sum of harmonics. A simpler signal is represented by a smaller number of harmonics, a more complex one - by a larger one. The rapidly changing signal, containing sharp peaks, incorporates high order harmonics. The more harmonics presented in the signal model, the more accurate, in general, the model reflects the real signal.
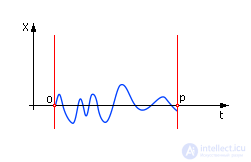
Let a certain signal X ( t ) be given (fig. 7.3).
| |
| Fig. 7.3. Input time signal Fourier transform (possible view) |
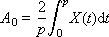
We will determine the time of consideration of the signal: if the signal is periodic , then the consideration time is equal to the period p of the signal; if the signal is non-periodic , then the period of the signal is considered the entire time of its consideration.
 | |
 |  |
 |  |
| ... | ... |
 |  |
| ... | ... |
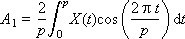
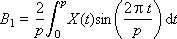
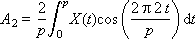
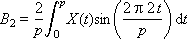
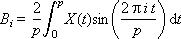
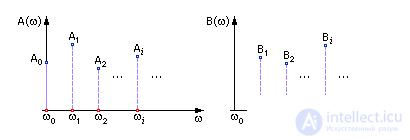
A i and B i are the weights of the corresponding harmonics present in the signal; i is the harmonic number. The formulas for their calculation are called the direct Fourier transform.
The value 2π · i / p = ω i is the frequency of the i -th harmonic. Note also that the frequency of the ith harmonic is related to the frequency of the first harmonic by the simple relation: ω i = i · ω 1 .
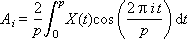
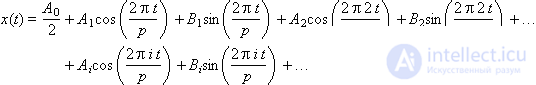
We note an important feature of this method of representation: instead of the entire signal in all its details, it is sufficient to store a vector of numbers representing the weighting factors of its component harmonics: ( A 0 , A 1 , A 2 , ..., B 1 , B 2 , ...). That is, these numbers fully characterize the original signal, since it is possible to completely restore the signal using the inverse Fourier transform formula:
These numbers are also used when processing the signal in the model of a dynamic system. The image of these numbers on the graph, depending on the harmonic number (frequency), is called the signal spectrum (Fig. 7.4). The spectrum shows how much the corresponding component is present in the signal. Spectrum is the frequency response of a signal.
| |
| Fig. 7.4. The signal presented in the frequency domain at the output Fourier transform, signal spectrum (possible view) |
Here the signal is represented in the frequency domain. Always by the formulas of the direct Fourier transform you can go from the time domain to the frequency domain, and by the formulas of the inverse Fourier transform go from the frequency domain to the time domain. In which area (frequency or time) to work with the signal at a particular moment, it is decided for reasons of convenience, clarity and economy of calculations. Note that, in terms of calculations, capacious operations of integration and differentiation of a signal in the time domain are replaced by operations of algebraic addition and multiplication in the frequency domain, which from a computational point of view is much more accurate and faster.
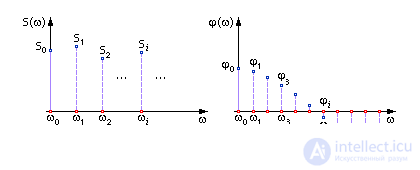
The number system A i and B i is a complete signal characteristic. The same complete characteristic of the signal is the system of numbers S and φ , which also form a spectrum (Fig. 7.5). S is the amplitude-frequency characteristic (AFC), φ is the phase-frequency characteristic (PFC).
| |
| Fig. 7.5. The signal presented in the frequency domain, amplitude-frequency and phase-frequency response of the signal (possible) |
Systems " A and B " and " S and φ " are fully equivalent. The transition from the “ A and B ” system to the “ S and φ ” system is performed according to the following formulas: S i = sqrt ( A i 2 + B i 2 ) is the absolute amplitude of the signal; φ i = arctg ( B i / A i ) is the phase of the signal, when adding harmonics, one should take into account the phase shift (phase shift is illustrated in Fig. 7.8).
In the case of the “ S and φ ” system, the inverse Fourier transform has the form:
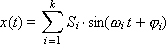
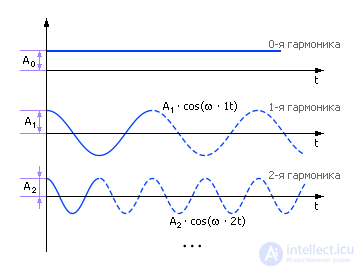
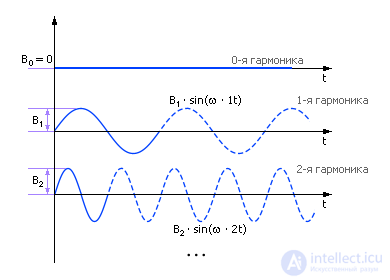
Fig. 7.6 and fig. 7.7 clarify the meaning of the coefficients A and B of different harmonics. These coefficients are the amplitudes of the sines and cosines of the corresponding frequencies (harmonics). In the time domain, they graphically correspond to the range of harmonic oscillations (Fig. 7.6 and Fig. 7.7); in frequency - the height of the spectral strip at the corresponding frequency (Fig. 7.4).
| |
| Fig. 7.6. Geometric illustration of parameters A and ω for the cosine component of the harmonic signal |
| |
| Fig. 7.7. Geometric illustration of parameters B and ω for the sine component of the harmonic signal |
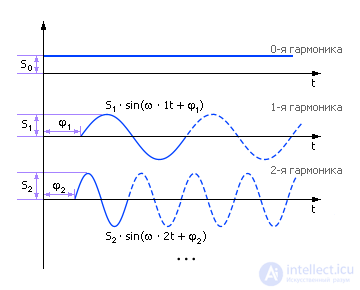
The meaning of the numbers S i and φ i is explained in fig. 7.8.
| |
| Fig. 7.8. Geometric illustration of the parameters S and φ for harmonic signal component |

Comments
To leave a comment
System modeling
Terms: System modeling