Fig. 7. Scheme of formation of a torus
The behavior of the system is characterized by the following parameters:
• an individual can move to any cell that has a common
the side. The direction is chosen randomly from the possible free.
• an individual can leave offspring in the cage from which it has moved.
Offspring appears periodically, the period is a parameter.
• if an individual is “predatory”, then it can devour its prey, while
moving to the place of the victim.
• the individual lives for a limited amount of time, called the lifetime
individuals are also a parameter.
• if the “predatory” individual does not find food for a certain time
(called the time of starvation), then it dies. Time is hungry
death is a parameter.
The constructed model investigates the behavior of the simplest qualitative model.
ecosystems of the oceans, consisting of predators and prey. In this way,
“Predators” are sharks, “herbivores” are fish. Additional factor
is flow - from right to left. The flow affects the behavior of fish, the behavior
It does not affect sharks - sharks choose a direction randomly from four possible.
If the shark is on a nearby cage with fish, then it moves to the cage
its victim, absorbing it.
Offspring appears in sharks and fish. Fish, like herbivores, bring
offspring more often than predatory sharks. In addition, the time of the death of the shark is chosen
in such a way that the shark brings the offspring only once for the entire period of life.
The individual dies after a period of life. If the time has come
“Give birth”, but the period of life has expired, the individual dies, leaving no offspring.
The model describes several important real-life phenomena, for example,
the process of population development in a closed area (graph of abundance versus
time falls on the so-called logistic curve, see fig. eight). Therefore
the graph shows that, having an unlimited amount of food, the population will not
to grow without limit, and will be released on some constant level.
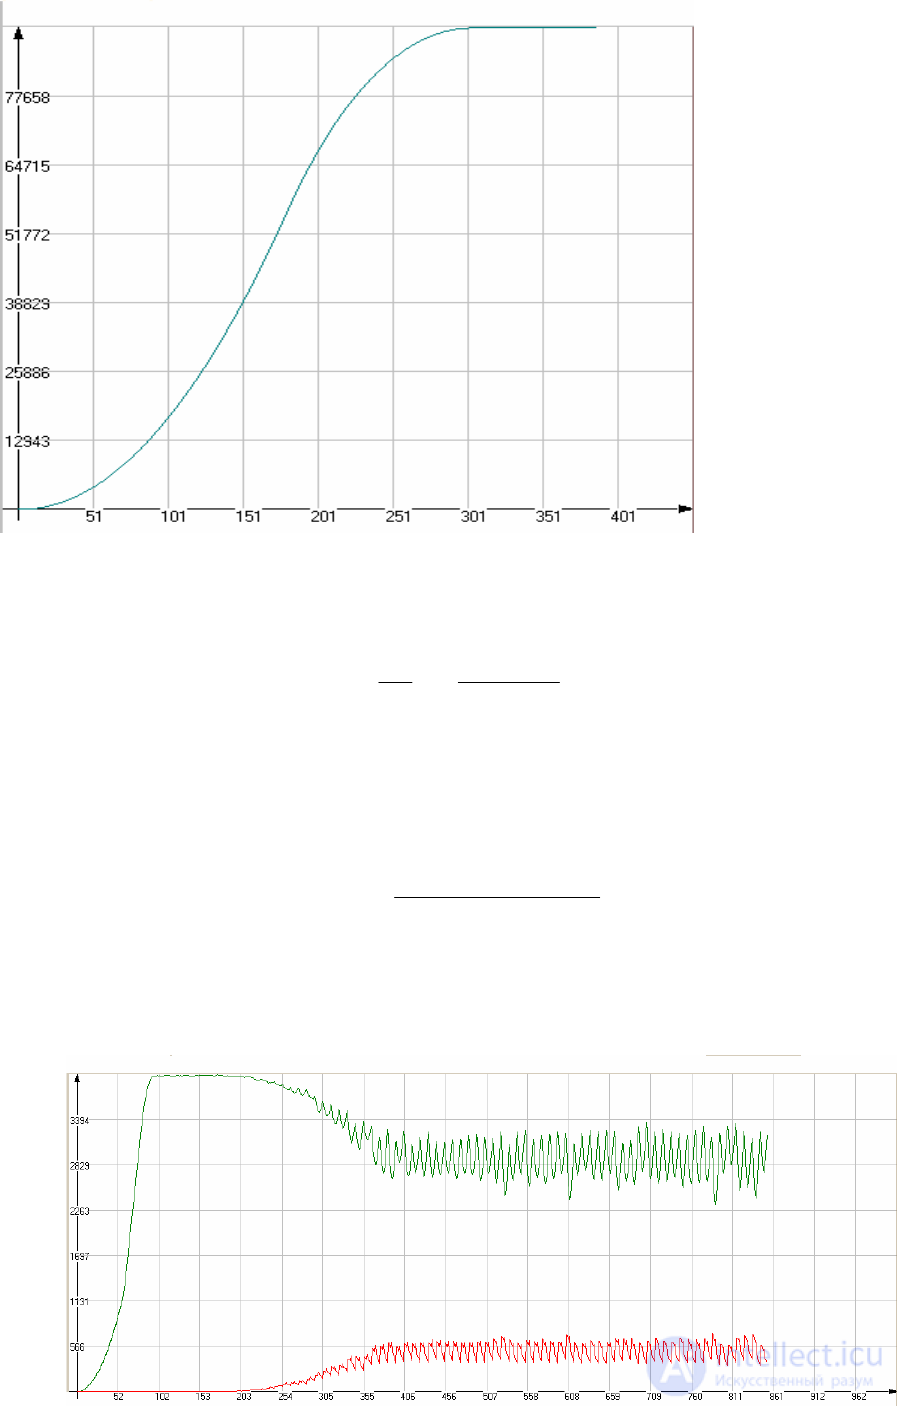
Fig. 8. Logistic curve
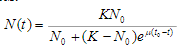
Fig. 9 Statistics on the behavior of two populations
Population growth is investigated from the point of view of many sciences, such as: ecology,
demography, biology and others. The key role in this issue is played by the model
Verhulsta, proposed by him in 1843:
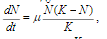 (one)
(one) here N is the number of individuals in the population, K is the range capacity (maximum
possible number of individuals), μ - coefficient characterizing the growth rate
populations. This equation is also called logistic, and the schedule for its solution,
accordingly, is called the logistic curve. Solution of this equation
as follows:
(2)
moreover, at time t = t0
population size was N (t0) = N0
In the case of two populations, the model describes the behavior of the biological
pendulum (Fig. 9). In this figure, both populations are in balance, i.e.
coexist, interacting with each other.
The peak of the development of the fish population is clearly visible (upper chart), then after
adding shark populations (lower) both populations are periodically
changes.
practical task for the game aqua-torus
• Place a few fish on the field. To trace the population dynamics in the area,
get the logistic curve. Match with logistic solution
equations (1). Choose the parameters of the Verhulst equation so that its
the solution best fit the change in numbers
populations.
• Place a few fish and sharks on the field. Explain why with time
the number of sharks does not increase.
• Place a few fish and sharks on the field. Change the lifetime parameter
sharks so that the shark has time to bring offspring twice during the life
(parameter in the range of 21-24). Wait for dynamic
equilibrium, estimate the period and amplitude of fluctuations in the number of populations.
Put a few fish on the field. Allow them to multiply. Further
put a few sharks. Change the parameters of the shark population so that
the fish are extinct. Give the values of these parameters.
• The same, but to achieve the extinction of sharks, changing the parameters of the fish, lead
values of these parameters.


Comments
To leave a comment
System modeling
Terms: System modeling