Lecture
If you are constantly using Google Analytics to monitor your site, then you need to know a few additional features that will help expand analytics for the site.
Google Analytics is almost perfect for collecting and analyzing statistics, but this tool does not show you everything you need. After making some adjustments, you can find out why and what visitors are doing on your site.
By default, Google Analytics does not automatically track user search queries within the site (if you have a site search). And such analytics is very useful, because you will know what content people are hoping to find, and for commercial sites - what products are in demand.
To enable this feature, click on " Edit " on the control panel to see the profile settings. Click on " Edit " again in the upper right corner - under the Site Search item select " Do Track Site Search " and enter " s " (without quotes) if you are using WordPress. And if not - you must enter the URL when searching on your site (for example, if the search URL is http://domain.com/?search=hello - you should enter " search " - without quotes).
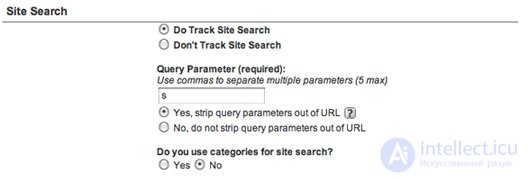
After that, you will see the statistics of what users are looking for using the site search.
Google Analytics allows you to create a standard report, for example: in the " Visitors " tab - Visits - the number of visits, Absolute Unique Visitors - the number of unique hosts, Pageviews - the number of views, Average Pageviews - the average number of views, Time on S ite - time spent on the site , Bounce Rate - the number of visitors who left the site and Percentage of New Visits - the percentage of new hosts - all of these are very useful indicators.
To create a custom report, click " Custom Reporting " and then " Manage Custom Reports ". Click "create new custom report " in the upper right corner and then you can drag and paste your indicators.
The example shows the statistics of my sites: The number of visits,% of new visitors, the number of visitors who left the site and the coefficient of effectiveness (more about that later) are the 4 main indicators for me, including keyword analysis.
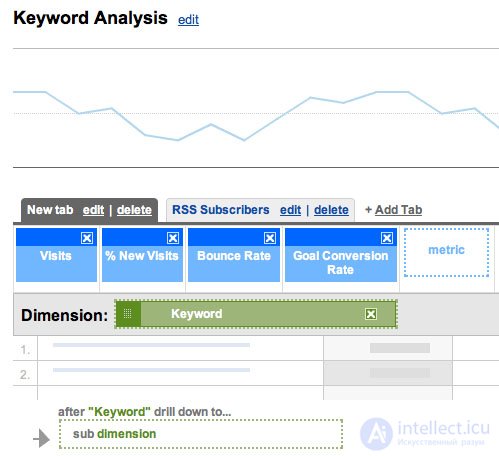
Enter the name of your report and click " Save Report ". since you have already saved the results - it is very interesting to experiment - press " edit " and experiment with the parameters presented on the left side.
You do not need to have a commercial website to set specific goals that you need to achieve. You can have a lot of tasks in front of a blog and you can set up Google Analytics to regularly report on the tasks you set. I have three main tasks: the number of visitors, readers and RSS subscribers.
To set goals, first go to the " Overview " tab (the page on which you move after logging in to the system). Next to your site, click " Edit " and then " Add Goal " in the " Goals " tab.
To track my RSS subscribers, I acted a little simply, tracking only visitors to my RSS page. Give the name (I called "RSS Subscribers"), use " URL Destination " as the type of target. In " Goal Details ", select Head Match to match the type and / feeds as the goal URL (you must use the appropriate URL of your RSS page)
To track blog readers (regular readers and not those that came to the blog, tired of reading and never returned), I used the parameter of time spent on the site. In my case, I was looking for keys who spent at least 4 minutes on the site. Then everything is the same as for " RSS Subscribers ", only in the type of goal, use " Time on Site " and in the Goal Details use the " Greater Than " condition and change the time to 4 minutes.
You can be more strict and instead of 4 minutes use 5 or 6 (or you just publish very long posts), but I would not recommend it.
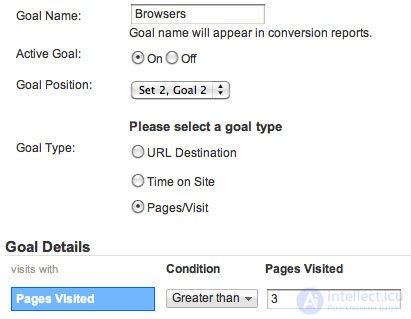
Well, the last goal I used was tracking of visitors, by which I mean people who viewed more than 3 pages.
To track them, use Pages / Visit as your target type. In the details ( Goal Details ), change the Pages Visited (number of pages viewed) to more than 3.
The ability to create additional statistics is one of the most useful features of Google Analytics , as it allows you to track the behavior of various groups and traffic sources. And I am very amazed and surprised at how in such a short period of time you can learn so much information about visitors.
To use advanced statistics, click on " Advanced Segments ", where you can add your own parameters. For example, if you want to track the behavior of targeted and non-targeted search traffic, search for " Medium " and use the following: " Matches Exactly " and select " Organic ".
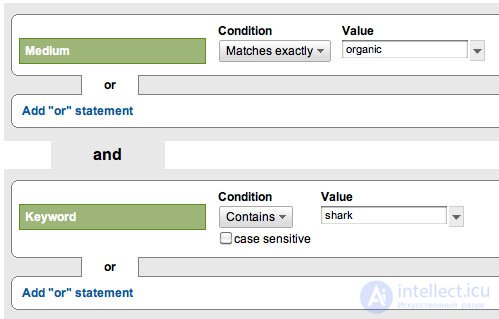
In the " And " item, add the " Keyword " and for definition use: in the condition (condition) select " Contains " and add the brand name in the " Value " field (I used the " Shark "). Name the segment as Branded Organic and save.
There are a huge number of segments in which you will be interested - search queries that contain the name of your brand, visits according to the words ' help ', ' buy it', etc .; transitions from social networks, etc.
Personally, it is very interesting to me how people who come from social networks behave: the time spent on the site, the number of people who immediately left the site and other indicators that can be compared with search traffic (both natural and paid).
Having created your segment, you can click the " test segment " and see very interesting data. It is always very interesting to experiment and if you have half an hour free, do it.
If you are interested in comparing different segments, you can click on the " advanced segments " tab in the upper right corner and check those segments that you want to compare.
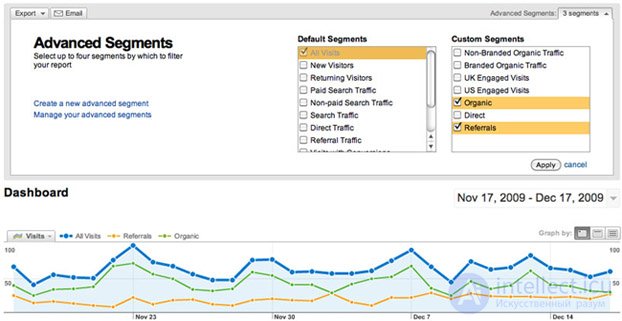
As you can see below, the comparison chart will look like this. Here it consists of 3 parameters, you can always "dig deeper" and use almost any statistics you want to see.
Experimenting with a comparison of the various parameters of your segments can reveal unexpected results that affect your site.
MyOST : We will often touch web analytics in the records; we will also touch Yandex.Metrics and Web-Vizora in more detail, as well as other tools used. As for additional literature, it is advisable to read "Google Analytics. Professional analysis of website traffic" is a really interesting and useful book, although I read it only at 70%; "Web analytics. Analysis of information about website visitors" - unfortunately it is desirable to read the original, the translator really "kills" this book, but if there is willpower - try to finish it; "Web analytics. Basics, secrets, tricks" - a fresh book from Alexey Yakovlev, already ordered, delivered in a week, and "Website promotion. Basics, secrets, tricks" - a joint product of A. Yakovlev and V. Tkkachev - has already been delivered. Also, in addition, I advise everyone and be sure to read the translation of "108 tips to improve site conversion."

Comments
To leave a comment
seo, smo, monetization, basics of internet marketing
Terms: seo, smo, monetization, basics of internet marketing