Lecture
6.2.1 General Information
In radio devices flow electrical processes that have a specific character. The real radio signal as a physical object of analytical and practical research is quite complicated. To analyze the signal passing through radio circuits, it is necessary to present it in a convenient mathematical form. In the theory of signals, two methods of mathematical representation and physical representation of electrical signals have found wide application: temporal and spectral. In the temporary method of analysis, the signal is reflected by a continuous function of time or a set of elementary pulses, following each other at certain time intervals. The spectral method is based on the representation (approximation) of a signal as the sum of the harmonic components of different frequencies, usually multiples of each other.
The analysis of processes in electrical circuits mainly depends on the complexity of the form of the signals arriving at them. In these cases, the spectral representation of signals often becomes effective. The fundamental idea of such a presentation belongs to J. Fourier. For periodic signals, Fourier introduced decomposition into various types of series — trigonometric, harmonic, complex, etc. Fourier also proved that non-periodic (pulsed) signals can be described using his two transformations - direct and inverse.
So, almost any signal can be represented as a sum of harmonic components (spectrum), the amplitudes and frequencies of which can be determined using the direct Fourier transform. This spectrum of harmonic components is often conveniently displayed graphically.
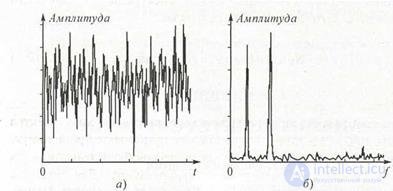
Figure 6.6 Signal representation: a - timing diagram; b - spectrum
if on the abscissa axis to postpone the designation of frequencies, and on the ordinate axis - the magnitudes of the amplitudes of the harmonics. In fig. 6.6 clearly shows the temporal and spectral representation of a rather complex waveform. Spectrum analysis includes the determination of both the amplitudes of the harmonics (amplitude spectrum) and their initial phases (phase spectrum). However, for many practical problems, it suffices to know only the amplitude spectrum. Therefore, under the analysis of the spectrum it is customary to understand the definition of the amplitudes of the harmonics of the signal under study.
Automatic representation of the spectrum of signals is carried out by special devices - spectrum analyzers.
Spectrum analyzers of electrical signals are classified as follows:
• by the method of analysis - sequential, parallel (simultaneous) and mixed;
• over the range of frequencies - low-frequency, high-frequency microwave, wide-range.
The main characteristics of the analyzers are: resolution, analysis time, and errors in measuring frequency and amplitude.
For the spectral analysis of non-periodic signals (functions) use the apparatus of the integral Fourier transform. In this case, the known formula of the direct Fourier transform is used, which characterizes the spectral density of the non-periodic
(pulse) signal:
 Sdt
Sdt
(6.2)
However, there is one circumstance common to all analyzer circuits that limits the accuracy of signal spectrum analysis: the Fourier transform is widely used in analytical studies of physical processes if the Dirichlet conditions and absolute integrability are satisfied. For real physical processes, these conditions are usually satisfied. Fourier transforms imply that the process u (t) is defined on the entire time axis from - ∞ to + ∞. Spectrum (6.6) is determined by the entire process that has ended. However, the measurements observe processes on a finite time interval Ta (analysis time, observation time), i.e. not ending in time. This discrepancy eliminates the model of the current frequency spectrum, defined by the relationship:
Ta
S ( j ω, T a ) = S (ω, T a ) = ∫ u ( t ) e - j ω t dt
0, (6.3) In other words, the current spectral density depends on the analysis time and the shape of the current spectrum generally differs from the true one the more, the lower the Ta.
The difference between the current spectrum and the spectrum of the terminating process depends on whether all characteristic features of the signal appeared during Ta analysis.
If the electrical signal investigated by the analyzer is periodic with a repetition period T, then it is necessary that the condition be met: Ta >> T.
When measuring the spectrum, the lower limit of the analysis time is finite, i.e. integration (averaging) is carried out in the range from 0 to Ta. Due to this, there is a methodological error in determining the components of the spectrum associated with the measurement method. This error for a number of technical applications does not play a special role, but in some cases it must be taken into account and investigated.
Instruments used to analyze the spectrum of signals can be divided into analog and digital.
Despite the many advantages of digital analyzers, analog analyzers are still widely used, especially in the upper part of the high-frequency and microwave ranges.
Modern analog spectrum analyzers contain digital devices. In almost all analog analyzers, the selection of the harmonic components of the signal is produced by narrow-band filters.
This method is implemented in two ways: parallel and sequential signal analysis. The main element of such devices is a band-pass filter (high-quality resonator) with a narrow bandwidth, which selects individual components or narrow frequency ranges of the studied spectrum.
6.2.2 Parallel and sequential spectrum analysis methods
Parallel-type analyzers are more often used to analyze the spectra of single pulsed signals. The analyzer circuit contains n bandpass filters Φ, each of which is tuned to a specific frequency (Fig. 6.7, a). The studied signal u (t) whose spectrum is located in the frequency band Δfn (Fig. 6.7, b) is fed to all filters simultaneously. The filters have identical frequency response with the same bandwidth Δff and are tuned to certain frequencies (Fig. 6.7, c). The signals at the output of the filters determine the components of the spectrum of the analyzed process.
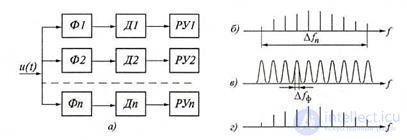
Figure 6.7. Parallel spectrum analysis: a - block diagram of the analyzer; b - the studied spectrum; in - frequency response of filters; g - spectrum at the output of the analyzer
(fig. 6.7, d). After detection in the detectors D, the spectral components are fed to the recording devices RU.
The bandwidth of the filter determines the static resolution of the analyzer (assuming that the analysis time is large, that is, Ta → ∞). The resolution of the analyzer - the ability to distinguish the components of the spectrum with similar frequencies. The narrower the bandwidth of the filter, the higher the resolution. With a wide bandwidth, several neighboring components will not be separated. If we estimate the resolution by the value of the frequency band Δƒp at which the separation of the nearest components is possible, then with an ideal (rectangular) frequency response of the filter, we can assume Δƒp = Δƒf. For real filters Δƒp = 2Δƒf. If the analysis time Ta is small, then we speak of dynamic resolution.
The required analysis time for the correct reproduction of the spectrum during a parallel study can be assumed to be τу - the time for establishing the voltage at the output of the filter with a rectangular frequency response and the working band Δƒf (from the level of 0.1 to the level of 0.9 of the steady-state value). From the theory of electric filters it is known that the establishment time τу = 0.86 / (Δƒf), therefore, Ta ≈ τу = 1 / (Δƒf). Then the speed of parallel analysis will be:
 v = ∆ f n = n ∆ f f = n ∆ f f 2
T a 1 / (∆ f f ), (6.4)
Analysis speed decreases when filter bandwidth is narrowed. The advantage of parallel type analyzers is the short analysis time. The error in the parallel analysis is affected by: the finiteness of the oscillation time at the filter output and its dependence on the passband, the difference in the characteristics of the filters tuned to different frequencies.
Sequential analysis is most often used to study the spectra of repetitive processes.
In fig. 6.8 shows a simplified block diagram of a serial-type spectrum analyzer. The analyzer contains a superheterodyne receiver, an indicator (often oscillographic) device and a calibrator. The superheterodyne receiver serves to sequentially extract the harmonic components of the spectrum of the input signal. The receiver consists of an input device, a mixer, an oscillator of the swept frequency GKCH, an intermediate frequency amplifier and
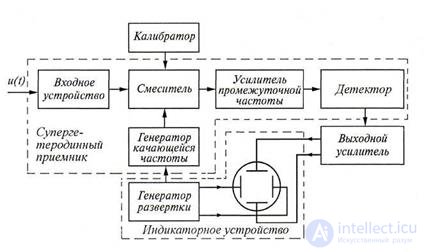
Figure 6.8 Block diagram of a spectrum analyzer of the sequential type
amplitude detector. To the receiver can be attributed and the output amplifier. The receiver is tuned to different frequencies using the voltage coming from the output of the sweep generator. With the help of the indicator device, the spectrum of the investigated process is observed. The calibrator is used to measure the characteristic parameters of the spectrum: frequencies corresponding to the maxima or zero values of the spectrum envelope, etc.
Consider the processes occurring in the spectrum analyzer (Fig. 6.8). The input signal u (t) is fed to the mixer through the input device. To the second input of the mixer receives a signal from the GCH.
In fig. 6.9, a, b are shown respectively the change in the frequency of the GCh frequency (fgcc frequency varies from fmin to fmax in time with the change in the voltage of the sweep generator), the shape of the amplitude-frequency characteristic of the frequency amplifier, and the spectrum diagram S (f) of the signal shown by three harmonic components, reflecting a single-tone amplitude-modulated oscillation).
When exposed to the mixer, the signal under study and the voltage of the GCh components of the spectrum S (f) are transformed into the intermediate frequency range S (f).
The shape of the signal spectrum is preserved.
With a linear change in the frequency of the GCCH, the spectral components of the transformed spectrum also vary linearly with time and successively fall into the passband of the IFA (Fig. 6.9, c). The voltage at the output of the IFA has the form of radio pulses (Fig. 6.9, d), the amplitudes of which at a constant voltage of the GCH are proportional to the amplitudes of the components of the spectrum under study.
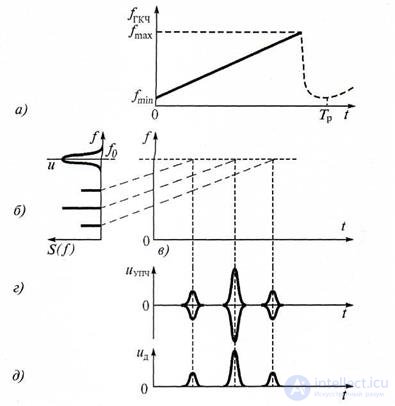
Figure 6.9. Signals in the spectrum analyzer of the sequential type: a - change of the frequency of the GCCH; b - the studied spectrum and frequency response of the HRO; в - linear change of frequency in time; g - signal at the output of the amplifier; d - signal at the detector output
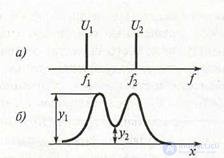
Figure 6.10 Diagrams to determine the resolution of the analyzer:
a is the signal spectrum; b - spectra diagrams
From the output of the HRO, the radio pulses fall on the amplitude detector.
At the output of the amplitude detector, video pulses ud are formed (Fig. 6.9, d), coming through the output amplifier to the vertically deflecting plates of a CRT. On a horizontally deflecting plate, CRT serves a sawtooth voltage of the sweep generator, as a result of which video pulses appear on the oscilloscope screen depicting the spectrum of the signal under study during one sweep period Tr = T a. The diagrams in fig. 6.9 were built under the condition that the frequency difference between the neighboring components of the spectrum is much greater than the frequency band of the amplifier, and relatively small static resolution is possible (that is, a large frequency interval Δƒр). In practice, some overlap of harmonic images is allowed (Fig. 6.10).
1. For what purpose are spectral analysis of electrical signals used?
2. What is the physical meaning of the direct and inverse Fourier transforms?
3. How analytically write the direct and inverse Fourier transforms?
4. What is the basis for the parallel and sequential analysis of the spectrum of the studied signals?
5. What is the simplified block diagram of the analyzer of parallel action?
6. What is the simplified block diagram of a spectrum analyzer of the sequential type?
7. How is the analysis speed related to the bandwidth of the spectrum analyzer?
8. What is the analysis time in sequential type circuits?

Comments
To leave a comment
METROLOGY AND ELECTROradio-measurement
Terms: METROLOGY AND ELECTROradio-measurement