Lecture
6.1.1 General Information
In radio engineering, linear quadrupoles are widespread, an important characteristic of which is the frequency transfer coefficient (usually just the transmission coefficient). The transmission coefficient of the circuit is defined as the ratio of the complex amplitudes of the output Uout (jω) = Uout and input Uin (jω) = Uin harmonic voltages of the same frequency ω:
K ( j ω) = K (ω) = U out = K (ω) e j ϕ (ϕ) U in (6.1)
The modulus of the coefficient | K (ω) | = K (ω) is called amplitude frequency response (AFC); the argument cp (co) is the phase-frequency characteristic (phase response) of the quadrupole.
 In the region of a certain frequency band, the response of the linear quadrupole to the input action begins to decrease. In this connection, the concept of bandwidth (working band) is used - the frequency domain, where the magnitude of the transmission coefficient K (ω) becomes at least 1/2 of its maximum value.
The bandwidth of a linear quadrupole lies in the region from the lower ω n to the upper ω in frequency and therefore its width is Δωо = ω in - ωн. In practical calculations, the cyclic frequency f = ω / (2π) is used rather than circular. Then the transmission frequencies of the linear quadrupole Δfо = fB - fH, where fB, is the upper one, and f n is the lower limit cyclic frequency.
Instruments for studying the frequency response usually allow you to take a curve of the dependence of the amplitude of the voltage at the output of the circuit from the frequency of the sinusoidal voltage at the input at a constant amplitude. When measuring the phase response, the frequency dependence of the phase difference between the sinusoidal voltages at the output and the input of the device under study is determined.
6.1.2 Method of removing the frequency response point
Instruments for research on the frequency response of linear circuits and devices are called frequency response meters. They are widely used in laboratory and industrial environments for tuning and monitoring radio equipment.
The block diagram for measuring the frequency response of linear circuits is shown in Fig. 6.1 a. The band generator of harmonic oscillations is rearranged in the studied frequency range.
It is convenient to take the amplitude-frequency characteristic using a digital voltmeter by points when the generator is sequentially tuned to frequencies f1, f2, f3, etc. According to the measurement results, the required frequency response is graphically constructed (Fig. 6.1, b).
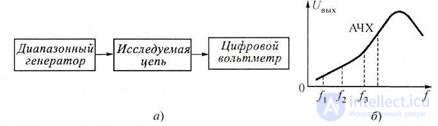
Figure 6.1 To the method of removing the frequency response of the points: a - block diagram; b - graphic construction of the frequency response This method is rather laborious. In addition, there may be omitted changes in the frequency response between the measurement points. The disadvantages of this method are especially noticeable when setting up radio engineering circuits, when after each change of circuit elements the whole procedure of removing the frequency response has to be repeated.
6.1.3 Panoramic frequency response meters
Panoramic frequency response meters, with an electron-beam or modern display, built on the basis of a sweeping frequency generator and a digital control and tuning circuit, are widely used. By the principle of operation, panoramic meters are close to heterodyne spectrum analyzers. However, there are differences between these devices, due to the fact that spectrum analyzers are used to measure the parameters of signals, and frequency response meters - to study the characteristics of circuits and devices.
The block diagram of the panoramic frequency response meter is shown in Fig. 6.3. The basis of the device is the oscillating frequency generator, which creates a high-frequency voltage with a periodically varying frequency. The law of frequency change is determined by the shape of the modulating voltage, which is used as a sawtooth sweep voltage. The voltage envelope at the output of the circuit follows the shape of the frequency response. If this voltage is applied to vertically deflecting plates of a CRT, then an image of the frequency response will appear on the screen.
The voltage on the indicator can be applied directly from the output of the circuit under study - the first mode, or after the detector and low-frequency amplifier - the second mode (switch in Fig. 6.3 in positions 1 or 2). The corresponding images on the display screen are shown in Fig.
6.4. The first mode is used in cases where the voltage on
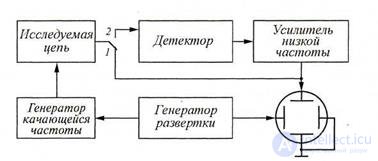
Figure 6.3 block diagram of the meter response
the output of the linear circuit has a sufficiently large amplitude. This eliminates errors associated with the nonlinearity of the characteristics of the detector and the uneven frequency response of the low-frequency amplifier. The second mode is used in the study of quadrupoles with a small coefficient
gain. Shown in fig. 6.4 horizontal line is drawn
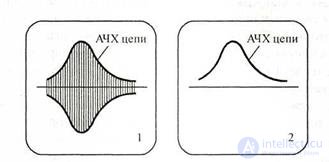
Figure 6.4 Images of the frequency response on the screen
Automatically during the return path of the beam. The oscillator of the oscillating frequency at this time is locked with the voltage of the sweep generator.
The applied frequency response meters of linear circuits except the elements shown in Fig. 6.3, have a number of additional devices that increase the accuracy of reproduction of the studied frequency response on the display screen and improve a number of other properties of the device. The purpose of these devices can be easily explained by the example of a block diagram of a panoramic meter response (Fig. 6.5).
According to the principle of operation of the frequency response meter, the horizontal deflection of the display beam should be proportional to the frequency, i.e.
it is necessary to ensure a linear relationship between
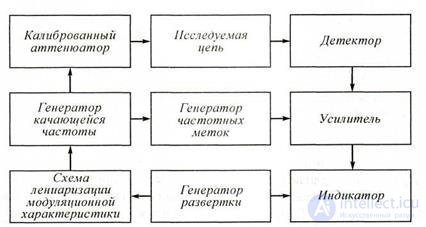
Fig. 6.5 Block diagram of a panoramic meter response
instantaneous values of the sweep voltage and frequency GKCH. Deviations from the linear dependence can lead to uneven frequency scale on the instrument screen and to distortion of the shape of the studied frequency response. To eliminate the drawback, a linearization scheme for the modulation characteristic of the GCP was introduced into the frequency response meter. However, the frequency sweep may be accompanied by a change in the voltage amplitude, which will lead to distortions in the shape of the studied frequency response on the display screen. Therefore, this device is provided with an automatic amplitude adjustment device (not shown in Fig. 6.5) that stabilizes the voltage at the output of the GCP.
To change the voltage applied to the circuit under study, an alternating calibrated attenuator is turned on at the output of the GKCh. Frequency measurements at characteristic points of the studied frequency response are performed using a frequency tag generator. As a rule, labels are formed from zero beats, which are obtained by offsetting the voltage of the GCh with a voltage, the spectrum of which contains a set of calibration frequencies. The amplified voltage of the tags is applied to the display and forms a frequency scale on the instrument screen.
1. What is called chain transfer ratio?
2. The method of removing the frequency response points.
3. Disadvantages of the method of removing the frequency response point.
4. Explain the operation of the panoramic frequency response meter circuit.

Comments
To leave a comment
METROLOGY AND ELECTROradio-measurement
Terms: METROLOGY AND ELECTROradio-measurement