A signal source, for example, a receiving antenna, is also a source of noise. In this regard, the equivalent circuit of such a source can be represented in one of two options:
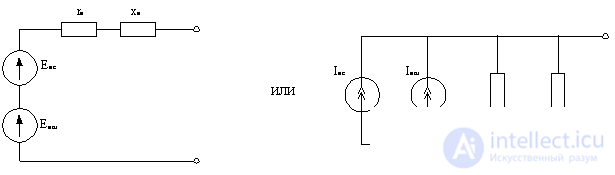
Figure 4.3.
Where
 .
.
The maximum power source gives to the matched load - this is the rated power.
If the load is understood as input resistance
 (
(  ).
).
devices loading the source, then the conditions for obtaining the rated power will be:
- resonance  or
or  ;
;
- coordination  or
or  . Then the rated power of the source
 .
.
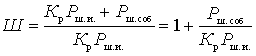
If you substitute in the last expression  , then we get the nominal noise power from the source
 .
.
Thus, the nominal noise power of the source does not depend on the resistance of the source.
In the absence of matching power noise from the source
 where
where  - mismatch coefficient.
To estimate the noise properties of a signal source, the ratio of the average signal power to the average noise power is used. In the quadrupole, through which the signal from the source passes, the signal-to-noise ratio deteriorates due to the added intrinsic noise of the quadrupole. The noise properties of the quadrupole are characterized by a noise coefficient, which shows how many times the signal-to-noise ratio at the output decreases as compared to the signal-to-noise ratio at the input:
 where
where 
- quadrupole transmission coefficient for power.
Composition  is the output noise power generated by the signal source. This shows that the noise factor is determined by the ratio of the total power of the output noise to its part, which is created due to the noise from the signal source. Therefore, we can write:
 ,(one)
Where  - the power of self-noise at the output of the quadrupole.
The concept of noise figure can only be used for a linear device. At the receiver, this is the path to the detector.
The noise figure of a passive quadrupole (for example, an antenna feeder) when it is matched with a signal source with a load is determined by the power transfer coefficient, since with matched load  at
at 
 .
.
With losses in the passive circuit  , W > 1.
To compare the noise with the signal at the output, it is convenient to refer all noise to the input, assuming that the receiver is not noisy, but only amplifies the input noise. From (1) the noise of the quadrupole referred to its input
 , or
, or  .
.
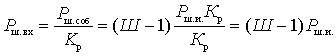
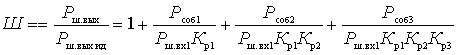
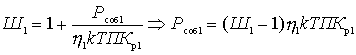
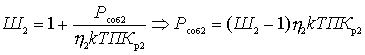
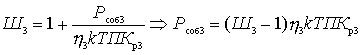
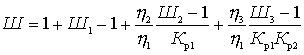
Find the noise coefficient of the linear path of the series-connected quadrupole.
Figure 4.4.
Each quadrupole is characterized by a power transfer ratio.  and noise figure
  . Suppose the mismatch coefficients are
  at the junctions of the quadrupole known.
 , (2)
, (2)
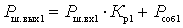
 - noise power from the signal source at the output of the path.
Considering that  get
get
 .
.
The power of the self-noise of one quadrupole at the output of the path can be represented as
 .
.
The noise of each subsequent cascade is amplified by all cascades except the previous ones. Therefore, we can write:
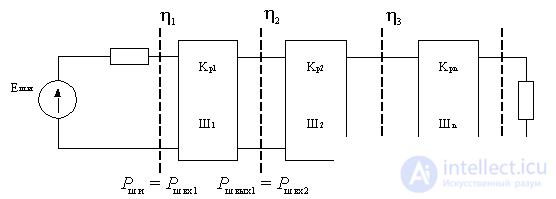
Figure 4.4.
 .
.
 ,
,
 ,
,
 ,
,
 ,
,
 ,
,
 ,
,
 ,
,
 ,
,
 .
.
Another output option:
 ,
,
 .
.
Substitute the formulas just obtained in (2)
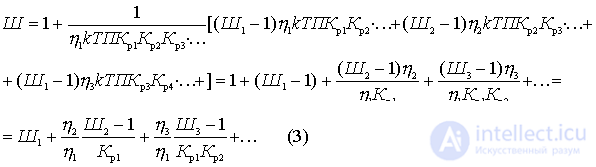
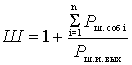
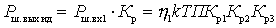
This important relationship shows that the noise factor of the first quadrupole is most significant. The effect of the subsequent four-terminal cascades is the smaller, the greater the gain of the preceding cascades. Therefore, the first cascades should be not only low-noise, but also with large  .
.
When working in the microwave range, the amplification of the first low-noise cascades is not very large, and the magnitude of W greatly depends on  ,
,  ,
,  ,
,  , etc. to obtain the minimum noise figure of the entire device W, it is convenient to characterize each of these caccades by a parameter called the noise measure
  :
:
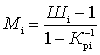 .
.
The smaller  and more
  the better this amplifier and the smaller its noise measure . Comparing amplifiers only in terms of their noise figure, it is impossible to choose the amplifier for the first stage correctly.

Comments
To leave a comment
Devices for the reception and processing of radio signals, Transmission, reception and processing of signals
Terms: Devices for the reception and processing of radio signals, Transmission, reception and processing of signals