Lecture
The universality of the harmonic collation of *** is also in the fact that any periodic signal can be composed (in this case they say: synthesized) only from harmonic collocations of *** with certain amplitudes, frequencies and initial phases. The section of the theory of signals, which deals with the decomposition of signals into harmonic components, is called harmonic analysis of signals or Fourier analysis. The main provisions of this theory are as follows.
Any periodic signal with a period T can be represented by summing a certain set of harmonic colons *** with circular frequencies equal to ωn = nω1 = = 2πn / T, where n is the harmonic number (natural number). In this case, the harmonic with the number n = 1 is called the main harmonic, and the harmonics with the numbers n> 1 are called the highest harmonics. In general, the number of such harmonics can be infinite. The signal represented by the sum of the harmonics can be written as:
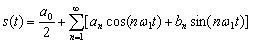 (4.6)
(4.6)
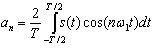
 (4.7)
(4.7)
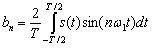
 (4.8)
(4.8)
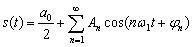
 (4.9)
(4.9)
 (4.10)
 (4.11)
 (4.12)
A graphic representation of the spectrum of signals is carried out in the form of a set of vertical segments beginning on the abscissa axis (on the frequency axis). The position of the segment on the x-axis (from the origin) reflects the frequency of the corresponding harmonic, and the length of the segment corresponds to the amplitude of this harmonic.
The operation of forming a complex signal from a set of harmonics is called signal synthesis. In practice, for the synthesis of signals, they usually use not an infinite series, but a limited set of harmonics (it is called a truncated Fourier series). It is clear that if the signal is represented by an incomplete set of harmonics, its shape will be distorted. One of the tasks of signal synthesis is the formation of signals with permissible distortions from a limited set of harmonics.
As an example, consider the formation of a signal close to rectangular, from a truncated Fourier series. Figure 4.6 shows the signals obtained by summing the first harmonics selected from the full Fourier series. Figure 4.6, and the dotted line shows the meander (symmetrical rectangular signal) m (t), the solid line indicates the level of the first harmonic a1 (t) contained in this signal. Figure 4.6b shows the spectrum of the first harmonic s1 (f). The spectrum of a harmonic (sinusoidal) coloration *** contains only one component at the frequency f = f1 = 1 / T, where T is the period of the colo *** ***. The periods of the original rectangular signal and its first harmonic coincide.
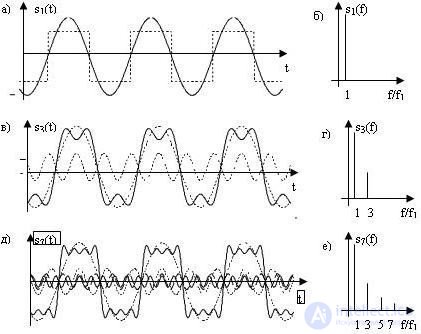
Fig. 4.6 Formation of a rectangular signal from the sum of the first harmonics: a), c), d) —the temporal representation of the first harmonics of the meander and their sum; b), d), e) - spectral representation of the corresponding sets of harmonics
In Figure 4.6, the dotted lines show the first and third harmonics contained in the meander, and the solid line is their sum. Note that the symmetric signals (including the meander) all harmonics with even numbers are missing (more precisely, their values are zero). The spectra of the first three harmonics are shown in Fig. 4.6, g (the level of the second harmonic is zero). Figure 4.6, d shows the first four non-zero harmonics (that is, harmonics with numbers 1, 3, 5, and 7) and their sum. Figure 4.6, e shows their spectra.
The figure shows that with an increase in the number of harmonics, the shape of the synthesized signal more and more approaches the square wave, and the difference between the square wave and the signal formed by the sum of the harmonic components becomes smaller.
In conclusion, it should be added that only periodic signals can be decomposed into a Fourier series, but the Fourier integral apparatus is used to analyze non-periodic signals.

Comments
To leave a comment
Devices for the reception and processing of radio signals, Transmission, reception and processing of signals
Terms: Devices for the reception and processing of radio signals, Transmission, reception and processing of signals