The visual phenomena described below are interconnected, some to a lesser extent, others more. However, to simplify the presentation, and also because some details of the phenomena are not clear, these phenomena are considered out of touch with each other.
Contrast sensitivity
It is known that the reaction of the eye to changes in illumination is non-linear. Let the light spot having an intensity  surrounded by background intensity
  (Fig. 2.3.1, a). Need to find a dependency on minimum increment
  which is seen by an observer. It has been established [11] that in a wide range of intensities the ratio
  , called the Weber ratio, has almost the same value - about 0.02. This result does not hold for very small or very large intensities, as can be seen from Fig. 2.3.1, and [12]. Moreover, the contrast sensitivity depends on the intensity of the surrounding background. Consider two spots of light with intensities and (fig. 2.3.1, b), surrounded by a background intensity
  . Relationship Graphs from for different background intensities are shown in fig. 2.3.1, b (right). It turned out that the range of intensities at which the ratio remains constant, much narrower than in fig. 2.3.1, a. The envelope of the minimum points of the curves in fig. 2.3.1, b coincides with the curve in fig. 2.3.1, a. However, the intensity range for an almost permanent relationship with a fixed background intensity comparable with the dynamic range of most electronic imaging systems.

Fig. 2.3.1. Contrast sensitivity measurements: a - no background; b - with the background.
Since the differential logarithm of intensity is
 , (2.3.1)
the same changes in the logarithm of the light intensity can be associated with the same barely noticeable changes in intensity in the range in which the ratio remains constant. For this reason, in many image processing systems, computational operations are performed using the logarithm of intensity rather than intensity.
Strip mach
Consider a stepped optical wedge (a set of strips of different lightness), shown in Fig. 2.3.2, a. The intensity of the light reflected from each strip is the same in its width and differs in the constant value from the intensity of light reflected from the neighboring strips. However, the right edge of each strip appears darker than the left. This phenomenon is called the Mach band effect [13]. In fig. 2.3.2, the image with intensity distribution is shown, which is shown in Fig. 2.3.2, d. This photo shows two columns - bright (B) and dark (D). None of them can be predicted based on the intensity distribution. The Mach bands, i.e., the apparent exaggerations of lightness variations, can be explained on the basis of the spatial-frequency characteristic of the eye. As we will see soon, the eye has less sensitivity in the region of low and high spatial frequencies in comparison with the sensitivity at medium frequencies. From this we can conclude that when creating image processing systems, one can sacrifice to some extent the fidelity of contour reproduction, since the eye is not very sensitive to high-frequency lightness differences.
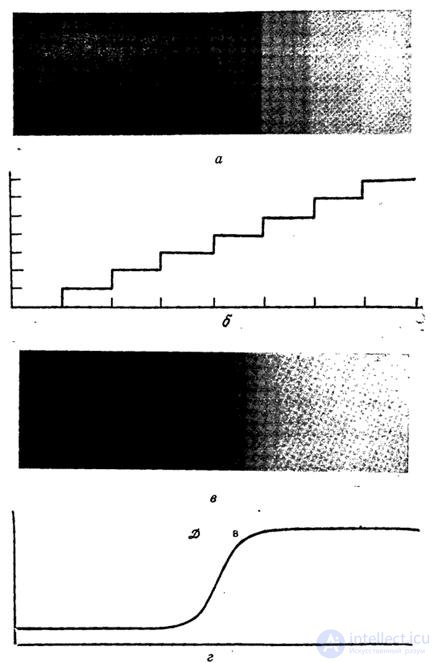
Fig. 2.3.2. Examples of Mach bands: a - step wedge; b - wedge intensity distribution; в - differential intensity; g - the distribution of the intensity of the day of the picture "in".

Simultaneous contrast
The phenomenon of simultaneous contrast [7] is illustrated by a photograph shown in Fig. 2.3.3. In fact, all small squares have the same brightness, but due to the different background brightness it seems that their brightness is different. The background color of the light spot also depends on the color of the surroundings. A white spot on a black square appears yellowish if the entire shape is surrounded by a blue background.
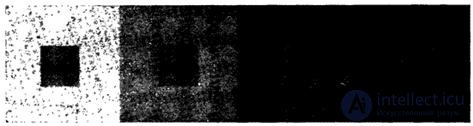
Fig. 2.3.3. An example of simultaneous contrast.
Changing the color of the steps in terms of heat and cold, lightness and saturation, or looking at the color wheel, you can see that the uniform color of the step is perceived by us unequally over the entire surface. The edge bordering the lighter degree appears darker and the edge bordering the darker one appears lighter. This visual feature is called light contrast. A single color is perceived by us differently depending on the neighborhood with different colors. Objects that are close in color appear to be the same when viewed separately, but it is worthwhile to arrange them side by side, as their color difference is immediately visible.
Painters are well aware that a single beautiful color in a certain color environment can turn out to be completely inexpressive, while the color “dirty” in the same environment will be sonorous and beautiful. At the same time, the gray tones of the achromatic series may acquire color shades. In these cases, the color contrast appears.
Color relationships are what ultimately determines the merits of color composition in the broadest sense of the word.
Consider light and color contrast in the examples.
As an example of bright contrast, let us draw a horizontal strip of medium gray tone with gouache paints, and then, above and below, let us place light steps of achromatic row from light gray to black along it. And then a uniformly covered horizontal strip will appear darker among light steps, and lighter among dark ones, and the steps themselves will be perceived as heterogeneous in lightness.
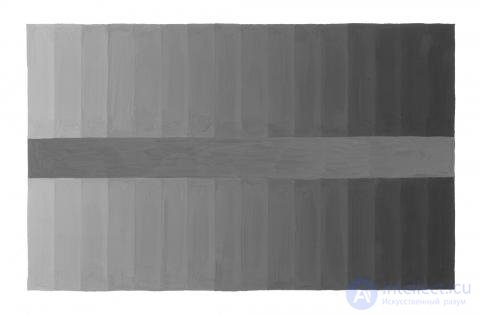
Table 18. An example of light contrast. Against the background of the steps of the achromatic series, a uniformly covered horizontal strip appears to be heterogeneous.
Let's go further. We will combine achromatic tones with color, chromatic. I will give an example from a natural phenomenon. The bright trunks of autumnal birch trees, which have a weak color saturation, looked out against the greenery of the winter crops, seemed pinkish, and acquired a bluish tint against the background of the buffy leaves. Against the background of an active color spot, the achromatic tone acquires a subtle shade of the opposite color (optional).
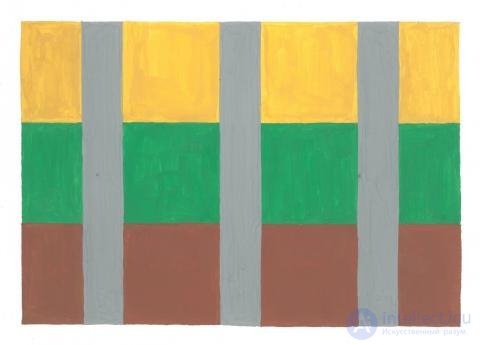
Table 19.
Let's perform a series of exercises: we will draw the same achromatic squares on a background of large, with different saturated colors. Gray squares, on the one hand, will begin to acquire color shades opposite to the surrounding color, and on the other hand they will be different in lightness. This is an example of both color and light contrast.
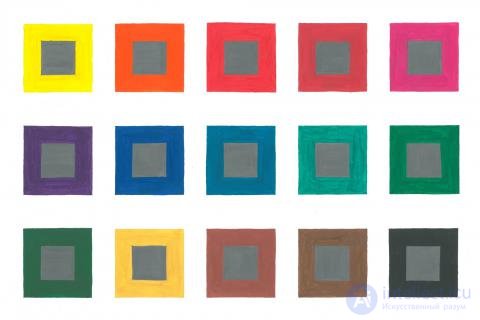
Table 20. Example of simultaneous color and light contrast.
You can create a set of tables consisting of a variety of color combinations, where it will sometimes be difficult to intertwine highlight and color contrasts. For example, a greater degree of color contrast can be achieved if, in the example above, instead of gray achromatic squares, place colored ones. The same colors in different color environments will become, in some cases warmer, and in others - colder, and their lightness will change.
Color Adaptation
Perceived color background depends on the adaptation of the viewer [14]. The American flag, for example, will not immediately be perceived as red-white-blue, if a person before this looked at an intense red light. The perceived colors of the flag will be shifted towards the blue color, which is in addition to the red.
Color blindness
Approximately 8% of all men and 1% of women in one form or another suffer from color blindness [15, p. 405]. There are varying degrees of color blindness. Some people, the so-called monochromats, have only sticks or sticks and cones of the same type and therefore they have the same color vision. Other people - dichromats - have two types of cones. Both monochromats and dichromats can distinguish colors to the extent that they have learned to associate different colors with different objects. For example, they may know that dark roses are red and light roses are yellow. But if you paint a red rose yellow, retaining the value of the reflection coefficient, the monochromat can call it red. Dichromates are also unable to accurately determine the color tone.
Subjective colors [16]
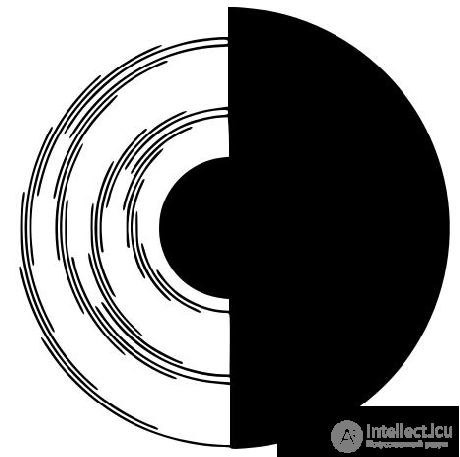
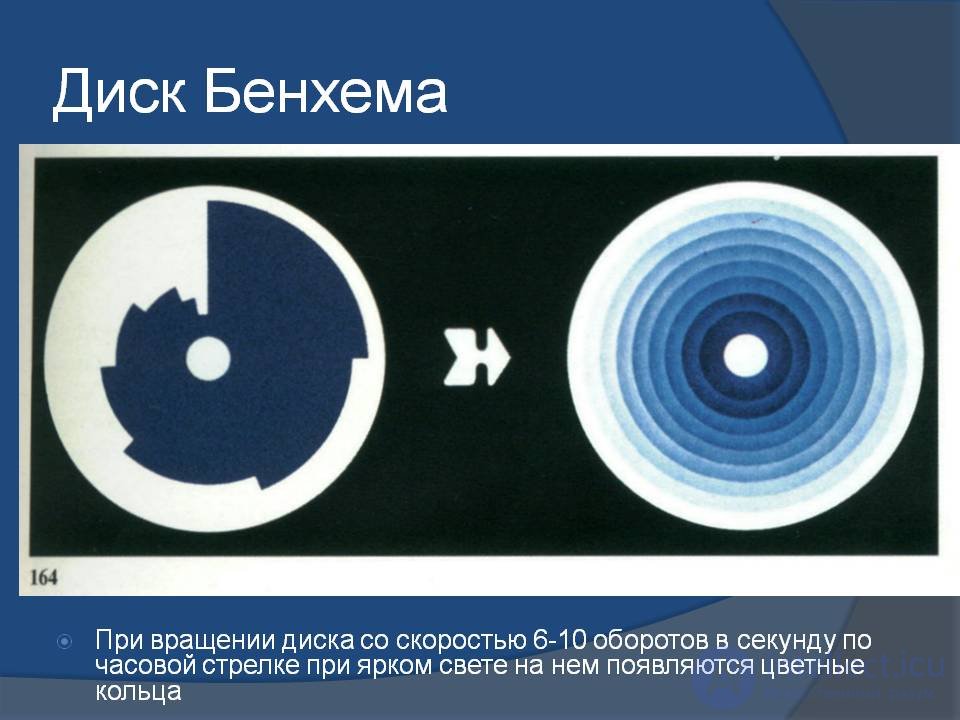
In 1826, the French monk Benidikt Prevost remarked that if you periodically illuminate a white sheet of paper by placing it in a narrow beam of light in a darkened room, then on this sheet you can observe colored stripes. This was the first recorded observation of subjective colors. In 1838, Fechner observed subjective colors appearing on a rotating disk, painted half black, half white. In 1894, Benham invented a spinning top, on the upper surface of which there was a pattern shown in fig. 2.3.4. When the top rotates counterclockwise, the outer ring appears red, the middle one is green, and the inner one appears blue. Rotation in the opposite direction leads to the fact that the colors of the outer and inner rings change places. These and related phenomena are partially explained by the nature of the temporal response of the human visual system to flashes of light.
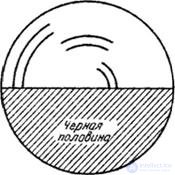
Fig. 2.3.4. Benham's disc.
Land's experiences
In the early 1950s, Land [17] conducted interesting experiments showing the ability to reproduce color using two primary colors. One of these experiments is illustrated in fig. 2.3.5. Some scene is photographed twice: for filters with bandwidths of ~ 600-700 and ~ 500-600 nm. Two monochrome slides are made  and
and  . Then these transparencies are projected onto one screen. The first transparency is illuminated with red light (wavelength 600-700 nm), and the second with white. There is an interesting effect: when both images are combined, the original scene is reproduced in almost natural colors (only purple colors are poorly reproduced). If the images do not slightly match, the color reproduction deteriorates dramatically. This shows that the reproduction of colors depends on the content of the scene, and is not a purely local phenomenon (that is, the color of a given point depends on the color of its surroundings).
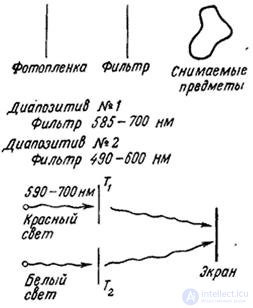
Fig. 2.3.5. Land's experiences.

Comments
To leave a comment
Digital image processing
Terms: Digital image processing