Lecture
When using one of the modern methods of developing optical systems, the optical system is considered as a linear system with respect to the light intensity, which can be described using a two-dimensional frequency response [18]. We investigate the linear optical system shown in fig. 2.4.1. The spatial distribution of the light intensity at the system input is obtained after passing a beam of light of constant intensity through a diapositive, the transparency of which varies sinusoidally. Due to the linearity of the system, the distribution of the light intensity at the output will also be sinusoidal, but perhaps different in amplitude or phase from the distribution at the input. By changing the spatial frequency (the number of periods of intensity change per unit length) of the light intensity distribution at the input and measuring the amplitude and phase of the intensity distribution at the output, one can in principle obtain the frequency response of the optical system.

Fig. 2.4.1. Linear optical system.
Let be  - optical frequency response of a two-dimensional linear system, and
  ,
,  - angular spatial frequencies (
  ,
,  , - periods of intensity change along the coordinate axes
  and
and  ). Let further
  denotes the distribution of light intensity at the entrance to the subject plane, and
  - distribution of light intensity at the output (in the image plane). Then the spatial-frequency spectra of the intensity distributions at the input and output will, by definition, be equal to
 (2.4.1)
and
 . (2.4.2)
These spectra are related as follows:
 (2.4.3)
The light intensity distribution at the output can be obtained by the inverse transform of the Fourier spectrum (2.4.2):
 (2.4.4)
In many cases, when developing optical systems, they are only interested in the ratio of the amplitudes of the intensities at the input and output. This attitude
 (2.4.5)
called frequency-contrast characteristic (MTF) of the optical system.
Many works have been devoted to the issue of using the concept of a linear system to describe the properties of the human visual system [19-25]. A typical experiment to verify the validity of the linear model of the visual system is as follows. The observer is shown two lattices with a sinusoidal change in the transmittance. One of them is the reference one, with constant contrast (the contrast of the spatial-periodic intensity distribution is the ratio of the maximum intensity to the minimum) and a given spatial frequency, the second is a test one, with variable contrast and a frequency that differs from the frequency of the reference grid.
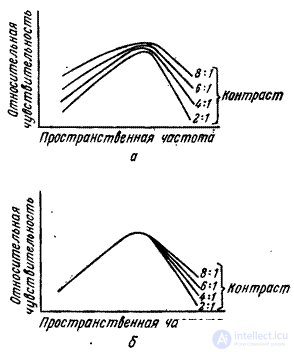
Fig. 2.4.2. The measurement results of the MTF of the human visual system: a - sinusoidal lattice; b - exponential sinusoidal lattice.
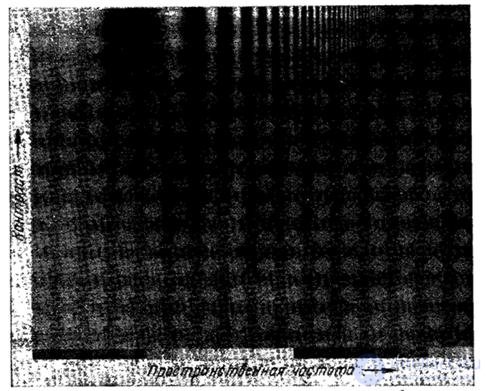
Fig. 2.4.3. Complicated sine wave.
The contrast of the test grid is changed until the brightness of the light and dark strokes of both grids appears to be the same. Applying a set of test grids with different spatial frequencies, it is possible to construct a graph of the MTF of the human visual system. In fig. 2.4.2, and the graphs of the MTF for different contrasts of the input signal. An idea of the MTF form can also be obtained by considering the complex sinusoidal grating shown in fig. 2.4.3. In this lattice, the spatial frequency increases along one coordinate, and the contrast along the other. The envelope of distinguishable strokes is generally close in shape to the curves in Fig. 2.4.2, and [24].
In fig. 2.4.2, and it is shown that the shape of the MTF depends on the contrast of the intensity distribution at the input. In addition, it changes when the test grid rotates around the optical axis of the eye. Thus, the human visual system is non-linear and anisotropic (it does not possess invariance with respect to rotation).
It was assumed that the nonlinear reaction of the eye to changes in intensity is logarithmic. Nonlinear transformation is carried out at the first stage of processing visual information in the visual system.

Fig. 2.4.4. Logarithmic monochrome vision model.
The receptor signals (sticks and cones) are subjected to transformation before they interact with each other. In fig. 2.4.4 shows the simplest logarithmic model of the eye for monochrome vision. If the reaction of the eye to the magnitude of the input intensity is indeed logarithmic, then, using the exponential transformation of the intensity of the sinusoidal lattice, it is possible to “linearize” the visual system. The MTF obtained as a result of measurement using an exponential sinusoidal lattice (Fig. 2.4.2, b) is well approximated by a single curve at low and medium spatial frequencies. In fig. 2.4.5 shows the measurement results of the MTF obtained by Davidson [26] for an exponentially sinusoidal test signal. The high-frequency part of this curve is obtained by extrapolating the input signal of average contrast.
The log-linear model of the eye (fig. 2.4.3) allows satisfactory prediction of the response of the visual system in a wide range of intensities. However, at high spatial frequencies and very low or very high intensities, the observed response differs from that predicted on the basis of this model. In order to obtain a more accurate model, it is necessary to consider in detail the physical processes in the visual system.
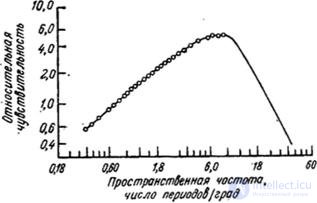
Fig. 2.4.5. The results of measurements of the MTF of the human visual system using exponential sinusoidal grids [26].
The nonlinear reaction of rods and cones to changes in intensity is still the subject of active research. It was hypothesized that the mechanism of this nonlinearity is explained by chemical activity, electrical effects and nervous feedback. The main logarithmic model suggests that
 (2.4.6)
Where  ,
,  and
and  - permanent, a and - input and output signals. In another model [7, p. 253], the following dependence of the output signal on the input signal is assumed:
 (2.4.7)
Where and - permanent. Mannos and Sakrison [27] studied various nonlinearities used in analytical measures of image fidelity. They found that the power non-linear dependence when
 (2.4.8)
Where  - constant, provides a good agreement between the calculated accuracy and subjective assessment of image quality. (The results of this work are discussed in detail in Chapter 7.) By selecting the constants appearing in expressions (2.4.6) - (2.4.8), the corresponding curves can be brought together quite well in the range of average intensities.
The spatial-frequency characteristics of the eye are explained partly by optical and partly neural mechanisms. As an optical instrument, the eye has limited resolution due to the finite dimensions of the lens aperture, optical aberrations of finite dimensions of rods and cones. These effects can be represented in the model by a lower spatial frequency filter incorporated between the receptor and the non-linear element. The most significant contribution to the frequency response of the eye is made by the mechanism of lateral inhibition [28]. The scheme of this mechanism is shown in Fig. 2.4.6. A nerve signal is a weighted sum of signals from many neighboring receptors. Some receptors make an inhibitory (i.e., negative) contribution to this amount. The weighting factors are essentially the impulse response of the part of the visual system located after the retina. The two-dimensional Fourier transform of this impulse response gives the corresponding frequency response.
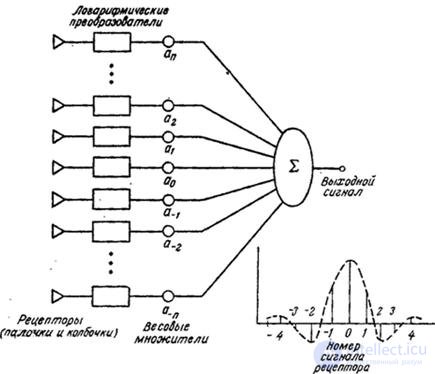
Fig. 2.4.6. The scheme of lateral inhibition.
The perception of a light pulse that enters the eye is delayed. After the end of the pulse, the sensation of light is delayed for a short time. These phenomena, arising from the non-zero duration of the visual system's time response, can be modeled with a linear time filter.
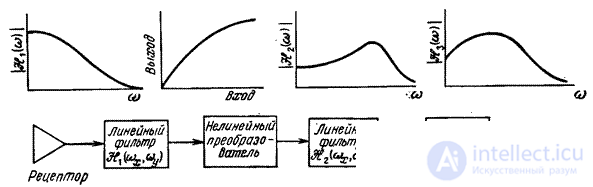
Fig. 2.4.7. Extended model of monochrome vision.
In fig. 2.4.7 shows a model of monochrome vision, taking into account the results discussed above. In this model, the receptor output signal is fed to the input of a linear low-pass filter corresponding to the optics of the eye. Further, an element with a monotonically nonlinear characteristic is included, which models the nonlinear response of receptors to a change in intensity. The process of lateral inhibition is taken into account by introducing a band-pass linear spatial filter. The effects of temporal filtering are modeled by the last link - a linear system. In [29], this model was thoroughly studied and the characteristics of its individual links were obtained, under which the full response of the visual system is modeled with great accuracy. With a good choice of scale factors, the considered model of monochrome vision will apparently be sufficiently accurate for most image processing tasks. Even a simplified logarithmic model (Fig. 2.4.4) is likely to be satisfactory in many cases.

Comments
To leave a comment
Digital image processing
Terms: Digital image processing