Lecture
Starting from the experiments of Newton and Maxwell [30–33], many theories have been proposed to explain the color vision of man. In the classic three-color model of color vision, developed by Jung in 1802. [32], it is assumed that the eye has three types of elements that are sensitive in different zones of the optical spectrum. It is interesting to note that before 1960. there were no direct physiological evidence of the existence of three different types of sensitive elements of the retina [9, 10].
In fig. 2.5.1 shows a diagram of the color vision model proposed by Frey [34]. In this model, three receptors with spectral sensitivities  ,
,  and
and  corresponding to the three pigments of the retinal cones create signals
 (2.5.1a)
 (2.5.16)
 (2.5.1в)
Where  - spectral energy density of the source of the incident light. Three beeps
  ,
,  ,
,  then subjected to logarithmic transformation and combined so as to produce signals
 (2.5.2a)
 (2.5.26)
 (2.5.2в)
These signals pass through linear filters with frequency characteristics.  ,
,  and
and  ; output signals
  ,
,  ,
,  determine the perception of colors in the brain.
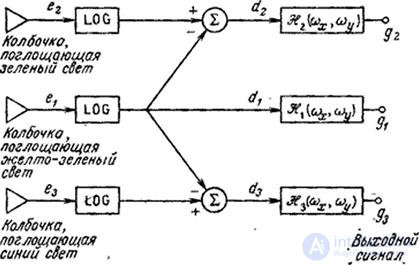
Fig. 2.5.1. Color vision model.
In the model of fig. 2.5.1 signals  and
and  characterize the color, and the signal
  proportional to brightness. It turned out that this model allows us to predict many color vision phenomena very accurately and is in good agreement with the basic laws of colorimetry. It is known, for example, that if the spectral density of the energy of a light source is multiplied by a constant (the same for all wavelengths), then the color tone and saturation described by the chromaticity coordinates will remain unchanged in a wide range of light intensity variations. Expressions (2.5.1) and (2.5.2) show that the chroma signals and in this case, they do not change, and the brightness signal changes according to a logarithmic law. Other features of this model are described by Frey [34].
As already noted, some spectral sensitivity data  Three types of retinal cones were obtained by measuring the absorption of light by cone pigments (see fig. 2.2.4). However, direct physiological measurements are very complex and cannot be performed with great accuracy. Indirect estimates of the spectral sensitivity of cones were obtained by Konig and Brodhun [35] when studying color vision anomalies. Judd [36], on the basis of these data, found a linear transformation that allows to establish the connection of spectral sensitivities with addition functions found in colorimetric experiments. As a result, the curves shown in fig. 2.5.2. They are unimodal and strictly positive, as it follows from physiological concepts.
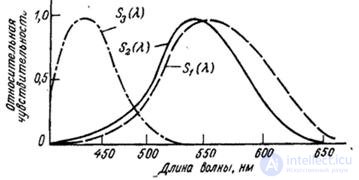
Fig. 2.5.2. Spectral sensitivity of cones according to Konig [35].
Similarly, a model of monochrome vision (Fig. 2.4.7), a logarithmic model of color vision (Fig. 2.5.1) can be supplemented with linear filters, which are included after receptors. Instead of a logarithmic function, you can use a nonlinear function of a general form. Note that, without changing the output signal, you can change the order in which the linear operations of summation and transformation are performed. The scheme of the extended color vision model is shown in Fig. 2.5.3. It can be expected that the spatial-frequency characteristic of the luminance channel, the output of which produces a signal , will be similar to the spatial-frequency characteristic of a system of monochrome vision, which was discussed in Sec. 2.4. The results of measurements of the frequency characteristics of the system in colored light are shown in Fig. 2.5.4. As can be seen, the frequency response measured using dyed light is shifted to low spatial frequencies compared to the frequency response measured with white light [37]. Lateral braking should cause the frequency response to bend at low frequencies. This bend is probably obtained at lower frequencies than those that were in the range under study.
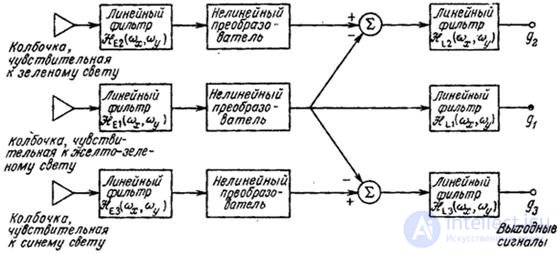
Fig. 2.5.3 Extended color vision model.
Perceived color is a relative concept. The sensation caused by light with a given spectral distribution of energy depends on the surrounding background and the adaptation of the viewer. A person can adapt very well to the lighting of the scene, using the reference white light or the overall color balance. This property is called color adaptation.
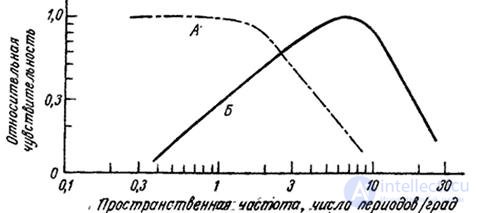
Fig. 2.5.4. The spatial-frequency characteristics of the human visual system [26, 37]: A - for the tinted color; B - for white color.
In the simplest color adaptation model proposed by von Chris [38; 15, p. 435], the automatic gain control unit is included in the scheme of the visual system (Fig. 2.5.3) between the cones and the first linear filter. Gain
 (2.5.3)
for  is set so that the amplified cone signal equals unity when viewing reference white light with a spectral density
  . Model von Chris attracts with intelligence and simplicity. However, experiments showed [15, p. 438] that this model does not fully describe the effect of color adaptation. Wallis [39] suggested that color adaptation can be partially explained by the action of the braking mechanism, as a result of which slowly varying components of the luminance field are weakened. This mechanism can be modeled with characteristics filters.
  (Fig. 2.5.3). Undoubtedly, both mechanisms - gain control and deceleration - provide color adaptation. Further analysis and experiments are required to correctly explain this phenomenon and build its model.

Comments
To leave a comment
Digital image processing
Terms: Digital image processing