Lecture
To create effective methods of quantization and coding of transformed images, it is necessary to know the statistical properties of the latter. This section defines the first and second moments of the spectral coefficients. The next section is devoted to the creation of a statistical model of the probability density of these coefficients.
Assuming an array of image elements  is an implementation of a two-dimensional random process with known expectation and a covariance function, then its spectrum (the result of a unitary transformation)
 (10.11.1)
will also be the implementation of a random process. According to equality (8.2.1b), the expectation 
 , (10.11.2)
Where  - expected value . Using equation (8.2.3), we can obtain the expression for the covariance function of the spectrum
 , (10.11.3)
where through  marked covariance function . Finally, the variance equals
 . (10.11.4)
In the vector representation of a unitary transformation, the vector formed by scanning the columns of the matrix of transformation coefficients is determined by the ratio
 . (10.11.5)
Mathematical expectation of this vector
 , (10.11.6)
a covariance matrix
 . (10.11.7)
Transform coefficient variance matrix  formed from the diagonal elements of the covariance matrix (10.11.7).
Let us now consider how the first and second moments of the transformation coefficient matrix are calculated with reference to specific unitary transformations. Obviously, in the general case, all the moments can be obtained as a series or a vector, making calculations using the above formulas. However, for designing and analyzing systems, it is desirable to have analytical expressions for the moment functions.
First consider the case of the Karhunen-Loeve transform. In general, the covariance function of the coefficients of this transformation is described by equality (10.11.3), which can be represented as follows:
 . (10.11.8)
However, formula (10.8.2) suggests that the second double sum coincides with the definition of the kernel of the Karhunen-Loeve transform. In this way,
 , (10.11.9)
Where  - eigenvalues of the covariance matrix of the image. Since the Karhunen-Loeve transform is orthogonal, i.e.
 , (10.11.10)
then the coefficients of this transformation are uncorrelated with each other, and their variances are equal to the corresponding eigenvalues:
 . (10.11.11)
The Karhunen-Loeve transformation is the only unitary transformation in which complete decorrelation of an arbitrary image is achieved. In other transformations, some residual correlation remains between the transformation coefficients. In addition, the Karhunen-Loeve transformation provides the greatest concentration of the energy of the image spectrum among all the unitary transformations. Suppose that the coefficients of an arbitrary transformation are arranged in decreasing order of their variances, i.e.  , also are the eigenvalues of the correlation matrix, i.e.
  . It can be shown that for any upper summation limit
  inequality holds
 . (10.11.12)
To find analytical expressions for the moments of other transformations, it is necessary to set the statistical properties of the image elements. If the image is stationary in a broad sense, then its expectation is constant, and therefore
 . (10.11.13)
But since the basis functions are orthogonal, the result of summation is nonzero only for the zero basis function of the ordered transformation. Consequently,
 at
at  , (10.11.14a)
 at
at  . (10.11.14b)
In those transformations where the number of basis functions includes a constant function, the double sum (10.11.14a) is equal to  .
.
If the image is stationary in a broad sense, the corresponding covariance function is  . However, the matrix of transformation coefficients will be stationary in a broad sense only if the transformation core has the property of spatial invariance. A clear confirmation of this is the Fourier transform.
Most commonly used image transformations are separable in the spatial domain. If, in addition, it is separable by spatial variables and the covariance function of the image, then
 , (10.11.15)
Where
 (10.11.16a)
 . (10.11.16b)
In this case, the dispersion of the spectrum (of the transformed image) is also separable, that is, it can be represented as a product of one-dimensional functions describing the change in dispersion along the rows and columns:
 . (10.11.17)
The one-dimensional dispersion of the Fourier spectrum for a stationary in a broad sense image has the form
 , (10.11.18)
Where  or
or  , but
, but  or
or  . This expression can be rewritten as follows:
 . (10.11.19)
The second sum can be considered as a one-dimensional discrete Fourier transform of the covariance function shifted by  counts. According to the theorem on the Fourier transform of the shifted function,
 , (10.11.20)
Where  and
and  - a pair of one-dimensional discrete Fourier transforms. From the relation (5.4.16) it is clear that is a discrete version of the energy spectrum
  line (or column) of the image, reduced by an amount equal to the average image power. For a process with zero expectation
 . (10.11.21)
The previously considered Hadamard, Haar, and other transformations do not possess the property that is given by the theorem on the spectrum of a shifted function for the Fourier transform. For this reason, for these transformations it was not possible to obtain in final form an expression for the dispersion or covariance function.
In fig. 10.11.1 shows the covariance functions of the coefficients of some unitary transformations of a segment of a discrete one-dimensional Markov process consisting of 16 elements, with the correlation coefficient between adjacent elements  . Graphs of the dispersion of transformation coefficients are shown in Fig. 10.11.2.
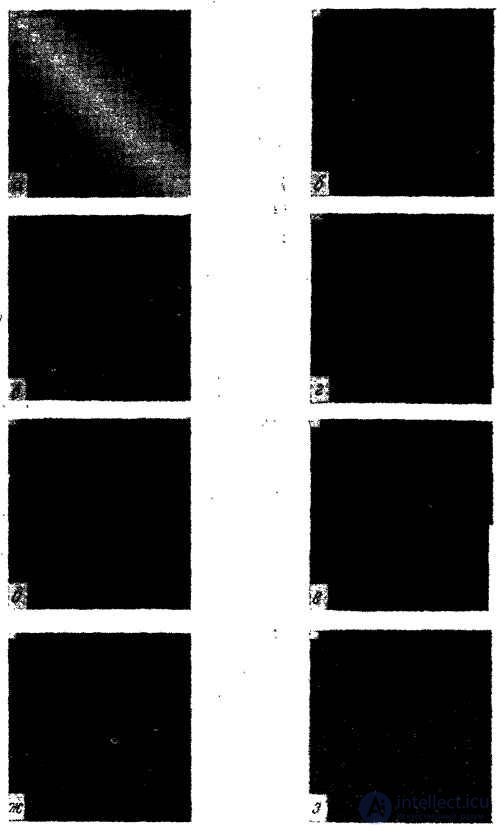
Fig. 10.11.1. Covariance matrices of unitary transformations with  .
.
a is the identity transformation; b - Fourier transform; in - cosine; g - sinus; d - Hadamard; e - Haar; W - inclined; h - Karunen-Loeva.
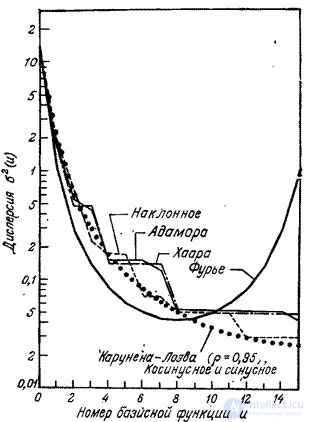
Fig. 10.11.2. Dispersion of unitary transformation coefficients with .

Comments
To leave a comment
Digital image processing
Terms: Digital image processing