Lecture
For an error-free recovery of a continuous image, it is necessary to limit the width of the spectrum of the original image, take samples of spatial variables with a frequency not lower than Nyquist, and interpolate the image samples. The question of interpolation is considered in the next section, and here an analysis of the effects arising from discretization with insufficient frequency is given.
If at such a discretization there is a superposition of the spectra, as indicated by the hatching in fig. 4.2.3, then false spatial harmonics will be introduced into the reconstructed image [11, 12]. In fig. 4.2.4 shows how the errors caused by the overlapping spectra look on the real image. Insufficient sampling rate leads to false low-frequency harmonics in the reconstructed image. In optics, this phenomenon is called moire patterns or moire effect.
According to equality (4.1.7), the spectrum of the discretized image can be represented as
 (4.2.12)
Where  describes the spectrum of the original image sampled with a period
  . Term
 (4.2.13)
describes those components of the sampled image spectrum that are obtained by repeating the original spectrum with periods  and
and  .
.
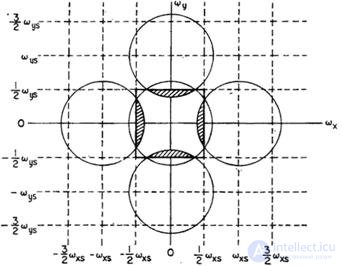
Fig. 4.2.3. Spectra of a two-dimensional function sampled with insufficient frequency.
In the absence of overlapping spectra, the optimal interpolation of the image samples can be obtained by passing the sampled image through an ideal low-pass filter with frequency response.


Where  - the normalizing constant. If the same method is used to restore the image sampled with insufficient frequency, then we get the image described by the function
 (4.2.15)
where is the term
 (4.2.16)
corresponds to the details of the reconstructed image that appeared as a result of the overlay. All amplitude modifying factors are included in .
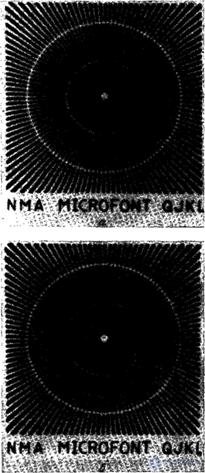
4.2.4. An example of the distortion caused by the superposition of spectra: a - the original image; b - sampled image.
The false component (4.2.16) can be significantly weakened by applying a filter for interpolation, the frequency response of which is consistent with the spectrum of the original image. This method is described in Ch. 15. A different approach will be considered below, in which to reduce the overlap of spectra, the image is subjected to low-frequency filtering before sampling.
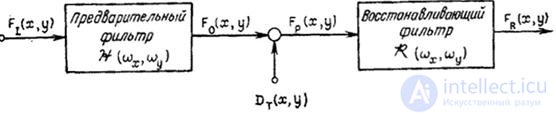
Fig. 4.2.5. To the analysis of errors caused by the imposition of spectra.
In fig. 4.2.5 presents a model that serves for the quantitative analysis of the effects associated with the overlapping spectra. It assumes that the original image  is an implementation of a two-dimensional random process with a known spectral density . The original image is passed through a preliminary linear spatial filter with frequency response.
  . We will assume that this filter provides a smooth attenuation of higher spatial harmonics (i.e. it is not an ideal low-pass filter with a sharp cut-off). Then the filtered image is sampled in increments of using the perfect spatial sampler. Next, the samples are interpolated in the recovery filter and a copy of the original image is obtained. According to equality (1.10.8), the spectral density image at the output of the pre-filter is equal to
 (4.2.17)
and the spectrum of the sampled image
 (4.2.18)
It is desirable to separate the effects caused by discretization with insufficient frequency and the consequences of inaccurate restoration. Therefore, we will assume here that the optimal filter with frequency response (4.2.14) is taken as the recovery filter. Signal power at  passing through such a filter, being equal to
 (4.2.19)
In the ideal case, the frequency response of the prefilter should match the frequency response (4.2.14) of the recovery filter. In this case, the power of the sampled signal is the greatest and is equal to
 (4.2.20)
The reduction in image sharpness associated with the introduction of a pre-filter can be expressed by the ratio
 (4.2.21)
The error caused by the superposition of the spectra is usually determined through the energy of the parasitic harmonics belonging to the shifted spectra falling into the passband of the regenerating filter. Suppose to simplify that the sampling rate is quite high and the contribution of the spectra shifted by  negligible when
  and
and  . The total energy of the error caused by the superposition of the spectra (see the shaded areas in Fig. 4.2.3) is equal to
 (4.2.22)
Where
 (4.2.23)
there is a signal energy at the output of the pre-filter. Then the error due to the overlapping of the spectra can be defined as [11]
 (4.2.24)
This error can be reduced by attenuating higher spatial harmonics. in the preliminary filter. However, any attenuation of the harmonics falling in the passband of the recovery filter leads to a deterioration in the sharpness of the image. Thus, a compromise has to be made between the sharpness of the sampled image and the error caused by the overlapping of the spectra.
Let us now consider the relationship between the magnitude of this error and the degree of reduction in sharpness with respect to several types of pre-filters. Probably the simplest method of spatial filtering an image obtained in incoherent light is to transmit the image through a limited aperture lens. Spatial filtering can also be accomplished by defocusing the optical system. In fig. 13.2.2 shows the dependence of the frequency response of a round lens on the degree of defocusing. Even using an accurately focused lens that does not have aberrations, some image blurring is obtained due to diffraction at the final aperture. Frequency response without a round lens  introducing only diffraction distortion, is equal to [13, p. 83]

 (4.2.25a)
 (4.2.25b)
Where  but
but  - distance from the lens to the focal plane. In the previous section, it was noted that non-ideal discretization, when the width of the sampling pulse is finite, is equivalent to the ideal sampling of the same image, but passed through a spatial filter, whose pulse response (after changing the direction of both coordinate axes) coincides with the shape of the sampling pulse. Thus, the sampling pulse can produce pre-filtering.
In the incoherent optical system of a scanning microdensitometer, the sampling pulse has a rectangular shape:
 (4.2.26)
The frequency response in this case is equal to
 (4.2.27)
A light spot with a two-dimensional Gaussian brightness distribution is formed in the cathode ray tubes.
 (4.2.28)
Where  characterizes the width of the beam. The frequency characteristic of the scanning system with a Gaussian spot looks like
 (4.2.29)

Fig. 4.2.6. The error caused by the imposition of spectra, and the loss of sharpness for different pre-filters with  .
.
In fig. 4.2.6 shows the graphs of the loss of sharpness and the magnitude of the error caused by the superposition of the spectra, from  for an aberration-free lens, as well as for square and Gaussian spots. The width of the square spot is chosen equal to
  so the first zero of the function
  coincides with the cut-off frequency of the frequency response of the lens. Gaussian spot scattering is equal to
  . In this example, the spectrum of the original image was modeled by the function
 (4.2.30)
Where  - amplitude factor,
  - integer parameter that determines the speed with which the amplitude of the spectrum decreases with increasing frequency, and
  - the spatial frequency at which the amplitude of the spectrum is halved. The curves shown in fig. 4.2.6, show that the prefiltration carried out with Gaussian and square shapes of the scanning spot gives approximately the same results, and an aberration lens with a final aperture with the same magnitude of the error caused by the superposition of the spectra gives a somewhat greater loss of sharpness. When using a defocused lens, the worst results are obtained.

Comments
To leave a comment
Digital image processing
Terms: Digital image processing