Lecture
Television systems are usually tested and tested using reference images that are either generated by electronic devices or obtained in the usual way when test charts are placed in front of the camera. This method is convenient due to its simplicity, but the connection of the results of such tests with the results of subjective examination, as a rule, is very complex.
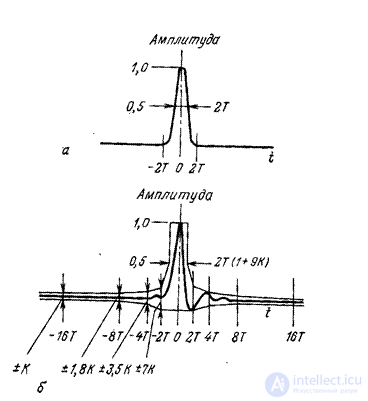
Fig. 7.2.1. An example of signal distortion estimation using factor  [eight].
In analogue television systems, signal distortion in the communication channel is often evaluated by comparing the transmitted and received signals. Fig. 7.2.1 explains the semi-quantitative method of such a comparison [8]. The test signal (Fig. 7.2.1, a) is called the sine-square pulse. The received signal (Fig. 7.2.1, b) is enclosed in a tolerance frame, the dimensions of which are determined by the parameter , and find the smallest parameter value. This value expresses the degree of distortion.
Using electrical test signals, you can check for geometric distortion, linearity of brightness transmission, and resolution of a television monitor. In fig. 7.2.2, a and 7.2.2, b are photographs of electronically generated test images used to estimate geometric distortions. The same images can detect the non-reduction of rays in a color TV. A photograph of the scale of brightness gradations, also formed by electronic means, is shown in Fig. 7.2.2, c. The linearity of the transmission of brightness can be estimated by comparing the amplitude of the signal with the intensity of light emission from the corresponding vertical bars on the screen. A table consisting of vertical stripes of white, yellow, blue, green, magenta, red, and blue has been developed to test color TVs [9-11].
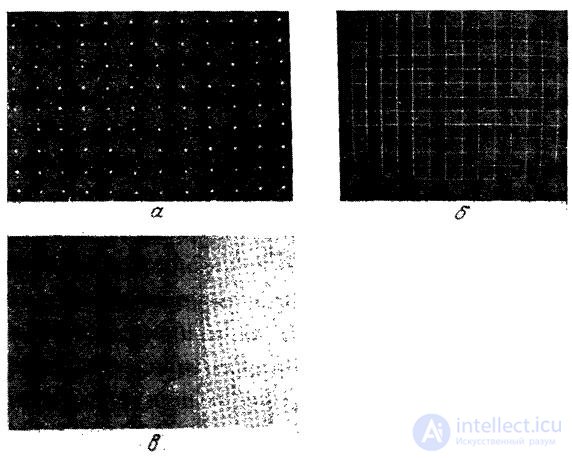
Fig. 7.2.2. Photographer test tables, formed on the screen of a CRT: a - point grating; b - grid; in - brightness wedge.
The resolution can be determined by measuring the distribution of the radiation intensity in the direction perpendicular to the boundaries of the bands.
The use of test signals and tables allows you to measure some of the physical characteristics of imaging systems. Given this, it is difficult to overestimate the usefulness of such methods for calibrating and tuning such systems. However, the results of tests on signals and tables cannot serve as quite general indicators of image quality.

Comments
To leave a comment
Digital image processing
Terms: Digital image processing