Lecture
The geometric image of the complex values of sinusoidal functions on the complex plane is called the vector diagram. Vector diagrams are widely used to analyze electrical circuits.
Consider an example:
Given: 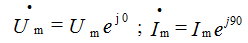
Construct a vector diagram on the complex plane: 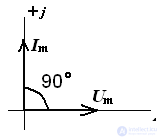
Analyzing the vector diagram, we can conclude that the current function is ahead of the voltage function by an angle of 90 °.
Similarly, a vector diagram of the actual values will look
Only the sizes of vectors decrease in time.
Consider the second example:
Figure 3 shows the electrical circuit node and shows a vector diagram of currents. It is necessary to determine the current I0 and construct a vector diagram of the currents. 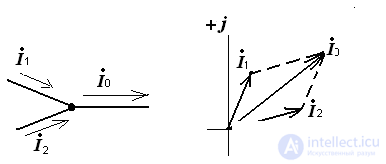
Pic.3
The current 0 according to the known currents 1 and 2 in the vector diagram is determined in accordance with the first Kirchhoff law according to the parallelogram rule.
Comparison of diagrams proves the importance of phase relationships in AC circuits, because, with unchanged amplitudes (effective values) of summed currents or voltages, the resulting values of these currents and voltages differ substantially in amplitudes due to the difference in phase relations

Comments
To leave a comment
Electrical Engineering, Circuit design
Terms: Electrical Engineering, Circuit design