Lecture
In the modern measuring technique BER, various schemes are used, from which two main ones can be distinguished [7.1].
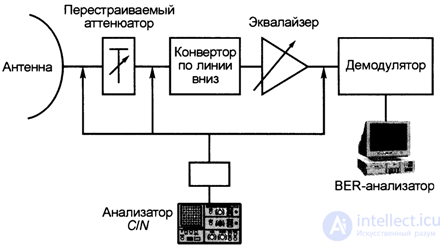 Fig. 7.16. Diagram of the tunable attenuator method.
In this method, a tunable attenuator is turned on in the radio frequency path of the receiver, with which additional attenuation is introduced, and the stability of the reception signal is assumed constant throughout the measurement time. The signal and noise levels are measured using a power meter, while measuring the noise in the intermediate frequency path of the receiver without filtering gives a value greater than the actual noise power in the working path band. Therefore, when measuring power, additional filters are used that are tuned to the working frequency band.
The BER error parameter is measured by a digital channel analyzer.
The main disadvantage of the method is the assumption of a constant power of the useful signal during the entire measurement period. In real conditions, the level of the useful signal undergoes significant fluctuations due to multipath propagation of radio waves and changes in propagation conditions. For this reason, the C / N ratio can also change, and even a 1 dB change in C / N can cause an order of magnitude change in BER. Thus, this method does not allow to provide the required accuracy of measurements, especially small BER values.
2. Interference measurement method of BER (C / AT), whose scheme is shown in Fig. 7.17, uses a special device - analyzer / simulator of the C / N parameter, which realizes measuring the power level of the useful signal C when a given noise level N is inserted, which ensures high accuracy in determining the C / N parameter. In this method, the analyzer / simulator automatically adjusts the level of noise introduced, while the measurement accuracy of the BER (C / AT) characteristic can reach values of ~ 1SG12 [7.1]. In conclusion of this review of the BER (СIN) function, we note the following.
1. A comparison of the theoretical and practical dependencies of the THSH / N) show that the practical dependencies differ from the theoretical ones in that the practical values of BER require a higher C / N ratio. This is due to various reasons for the deterioration of the parameter in the intermediate and radio frequency paths.
2. In practice, the contributions of the radio and intermediate frequency paths are comparable with each other, while for systems of transmitting digital information at speeds up to 90 Mbps, the following values of degradation levels of the BER parameter are observed.
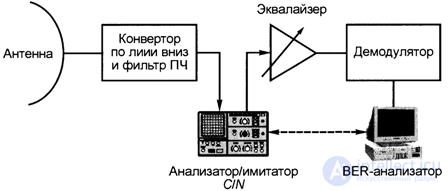
Fig. 7.17. Diagram of the interference method of measuring BER (С / N)
Deterioration in the IF intermediate frequency path:
- errors in phase and amplitude of the modulator - OD dB;
- intersymbol interference due to filter operation - 1.0 dB;
- the presence of phase noise - 0.1 dB;
- differential encoding / decoding procedures - 0.3 dB;
- jitter (phase jitter) - 0.1 dB;
- excess demodulator noise band - 0.5 dB;
- other causes (aging effect, temperature instability) - 0.4 dB.
So, in the total in the IF path, the degradation of the BER value can reach 2.5 dB. BER degradation in radio frequency path:
- effects of nonlinearity - 1.5 dB;
- deterioration associated with limiting the channel bandwidth and group delay time - 0.3 dB;
- interference in adjacent channels - 1.0 dB;
- deterioration associated with damping effects and the appearance of an echo signal - 0.2 dB. In total, in the RF path of the RF frequency, the BER will deteriorate by 3 dB, that is, the system’s total
Transmission BER degradation can reach -5.5 dB.
It should be noted that in the diagrams of fig. 7.16, 7.17 did not consider the assignment of equalizers in digital radio paths.
Measurements of frequency and power in the radio frequency paths.
Measurements of frequency and power of a useful radio signal are implemented in practice by the following methods:
1) Frequency meters and power meters are used,
2) spectrum analyzers with marker measurement functions are used.
In the second method, the marker provides movement along the spectral characteristic with simultaneous display of the values of the parameters of the frequency and power of the useful radio signal.
To expand the capabilities of measuring power parameters, modern spectrum analyzers provide smoothing of the spectral characteristic, filtering noise, etc.
Analysis of the equalizers.
Compared to cable systems, radio broadcasting, as a medium for transmitting radio signals, has characteristics that randomly change over time. Due to the widespread use of digital radio communication systems and increased demands on the accuracy of their transmission in receivers, equalizers are enabled, which dramatically reduce the effect of multipath propagation (equalization of signals) and group delay time (auto-tuning of the signal). When using digital modulation of high-frequency signals, developers have encountered difficulties in fine-tuning modems and other channel-forming devices as part of the radio frequency path. In this case, the equalizers also act as elements of compensation for possible nonlinearities in devices of the radio frequency transmission path. In modern radio frequency information transmission systems there are two main types of attenuation associated with the factors of radio signal propagation through the radio frequency path.
1) Linear attenuation, which is a frequency-independent uniform reduction of the signal amplitude from the signal distribution factors. Linear attenuation is usually caused by natural factors of electromagnetic wave propagation:
- when through the spread in forests;
- at distribution in the atmosphere in the presence of hydrometeors (rain, snow).
2) Attenuation due to multipath propagation of radio signals.
These two factors change the amplitude of the useful signal, leading to a change in the C / N ratio, which ultimately affects the BER error parameter. Changes in the structure of the useful signal associated with these two attenuations are compensated by equalizers. As you know, the basis of the work of any equalizer is the use of a narrow-band notch filter to eliminate the non-linearity of the useful signal. The main parameter of measurements is the dependence of the filtering depth on the frequency for a given BER parameter, which in various reviews is called the M curve or the W curve (Fig. 7.18).
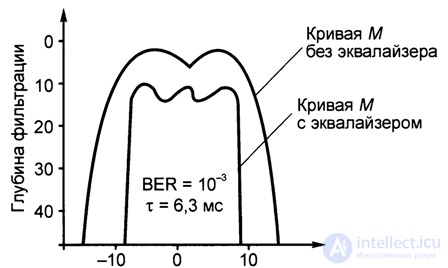
Fig. 7.18. M curves for the absence and presence of an equalizer.
To obtain the M curve, various conditions of signal passage are usually simulated, which are compensated by the equalizer, and the M curve is constructed during the compensation process. The measurement scheme is shown in Fig. 7.19.
As a result of measurements, diagrams are obtained in the form of two-sided M curves, one of which is hysteresis-free (showing the ability of the equalizer filter to provide a filtering depth at a given frequency sufficient to equalize the structure of the useful signal) and the other is hysteresis (showing the filter’s performance when it is actually working first increase and then decrease the filter depth parameter). In practice, both types of curves are essential for analyzing the operation of the equalizer.
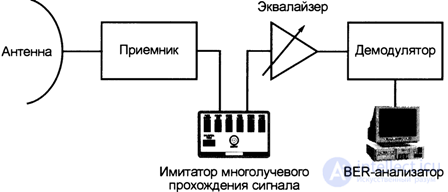
Fig. 7.19. The measurement scheme of the curves M
Measurement of parameters of non-uniformity of the phase-frequency characteristics and group time delay.
The non-uniformity of the phase-frequency characteristic (PFH) of the radio frequency path is determined by the group delay time (GDT) from the formula:
Direct measurement of the dependence of the phase shift on the frequency f (w) and the subsequent differentiation of the obtained dependence is implemented, as a rule, for systems with a low level of phase noise, however, for radio communication systems, phase noise in the channel is present, which leads to non-uniformity of the phase response and change in the GD. Usually, the measurements of the GDT are carried out during the acceptance tests of radio systems and take into account possible deviations in the operation of the transmitter, receiver, antenna devices and radio signal propagation conditions. In [7.10], two methods for measuring the GDT based on the use of composite radio signals were described.
Measurements of parameters of resistance to linear attenuation and attenuation associated with multipath propagation of radio signals
The parameters of radio signals change due to linear attenuation and attenuation caused by multipath propagation of radio signals. When carrying out factory tests, a permissible limit of linear attenuation is introduced, not exceeding 50 dB for BER = 10 ~ 3. To compensate for linear attenuation, use equalizers in the transmitter / receiver. The operation of an equalizer that compensates for linear attenuation can be measured using tunable attenuators.
When measuring the attenuation resistance parameters associated with multipath propagation of radio signals, it is possible to use a state diagram and an eye diagram, which display:
- state diagram - signal crosses / and Q are displayed as ellipses,
- eye diagram - the phenomenon of multipath is displayed by the displacement of the centers of the "eye" from the center to the edges.
However, both the state and eye diagrams do not provide all the necessary measurement specifications. To carry out practical measurements of the efficiency of compensation of the phenomenon of multipath signal transmission, methods are used that are consistent with the methods of compensation. Since it is almost impossible to predict the occurrence of a multipath factor, taking into account the effect of this factor is performed using stress methods, that is, by simulating the phenomenon of multipath signal propagation. As noted in [7.10], two models of simulated multipath propagation are used.
1. Double-beam model. The principle of modeling is reduced to the theoretically substantiated assumption that the attenuation is due to two-beam interference, and the interfering beam has a delay (for the reflected beam) in time. From the characteristics of the non-uniformity of the frequency response (amplitude-frequency characteristics) and the GDT for two-beam propagation of the radio signal follows [7.10]:
- reduction of amplitude with frequency;
- the change in the GVZ and the frequency response in the case of the minimum phase (when the main radio beam has a large amplitude);
- a change in the frequency response and the square head in the case of a non-minimal phase (when the resulting beam, after the interference of two beams, exceeds the main signal in amplitude).
2. Three-beam model. Since the two-beam model does not describe the phenomenon of amplitude modulation and the occurrence of weak beat patterns within the working frequency range, as a result of which the amplitude of the useful signal deviates within the working range, even if the beat node is outside the working range, a three-beam model is used, allowing amplitude bias effect. Usually, the two-beam model is used for qualitative measurements, and the three-beam model for accurate measurements [7.10].
Intermodulation interference analysis.
During the propagation of radio signals in the path, intermodulation interactions of signals occur during multiplexing and demultiplexing, as well as under the influence of nonlinearity of channel-forming devices as part of the path. Usually intermodulation distortion have a rather low level - less than 40 dB relative to the level of the useful signal. Nevertheless, the control of intermodulation distortions and the elimination of their causes in some cases provides a solution to the problem of interference in adjacent channels. Spectrum analyzers are used to analyze intermodulation.
Measurements of the characteristics of channel-forming radio frequency paths.
In addition to complex measurements, measurements of the characteristics of the channel-forming radio-frequency paths are widely used in practice, the knowledge of which is necessary in the design and operation of radio information transmission systems. In addition to measurements of frequency and power in the service area, there is a need to measure antenna systems, the level of thermal noise, frequency stability of master oscillators, phase jitter, modem parameters and amplification paths along with filtering devices.
Measurement of antenna systems.
Antenna-feeder devices as part of the radio frequency path play an extremely important role. The main parameters: radiation power, radiation pattern in the respective planes, gain, impedance, etc., are usually calculated and measured during the antenna production phase. During operation, important parameters are
- traveling wave ratio (КБВ): КБВ = Umin / Umax, (7.38)
- standing wave ratio (CWS): CWS = 1 / IPM, (7.39)
- the level of return loss from the antenna input, where Umin and Umax - the minimum and maximum voltage in the feeder line.
In the case of an ideal path matching: transmitter output - feeder - antenna input, KBB = 1 (since all energy from the transmitter’s output is sent to the antenna and, in addition, £ / min = Umх), in the case of Umin = O, KSV = oo KBB = 0 - in the feeder there is a standing wave mode, which is unacceptable.
 In the real case, the CWS can take values of 1.1 ... 2, that is, IPM = 0.5 ... 0.9. In the radio paths of digital information transmission systems with digital modulation types, a low level of return loss is required, that is, the minimum value of the CWS -1.1, when the mode in the feeder line is close to a high degree of matching.
For example, for radio relay links using 64 QAM modulation, the recommended level of suppression of return loss from the antenna is 25 dB and higher. To measure return loss, the circuit shown in Fig. 1 is usually used. 7.20.
From the microwave oscillator, a signal is fed to the antenna through a passive directional coupler. In the presence of a wave reflected from the input, electromagnetic oscillations through a directional coupler enter the spectrum analyzer (or selective receiver), where the level of reflected power is measured. To reduce the reflected power level, the antenna-feeder path is coordinated. When applied in practice, instead of a spectrum analyzer of a power meter, the measurement accuracy decreases, since together with the reflected signal, the power meter takes into account the level of noise associated with external influences on the radio channel in a given range of operating frequencies.
Measurement of the level of intrinsic thermal noise of the elements of the radio frequency path.
As the level of noise increases, intersymbol distortion of digital signals sharply increases and the BER value increases. On the state and eye diagrams, this results in an increase in the size of the state display points and the “eye closure” effect. Noise measurement of various devices in the radio frequency path is performed at the stage of operation to localize the point of increased noise level. Given that the intrinsic noise of various devices of the radio frequency path is small, differential methods are used for measurements. To do this, the interfering single-frequency signal is mixed into the tested signal and then noise is measured by the difference of the interfering signal and noise. This method is used to measure low power noise. As an example in fig. 7.21 shows the results of noise measurements on the background of the interfering single-frequency signal for modulation of 16 QAM with the signal / interference ratio C / I = 15 dB, while, as can be seen from the figure, the increase in the noise level leads to an increase in the size of points on the state diagram and the effect of “closing the eye” "On the eye diagram.
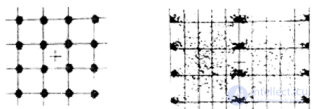
Fig. 7.21. Examples of the state diagram and the eye diagram when measuring noise at C / 1 = 15 dB.
Phase jitter measurements.
 An important parameter of measurements of radio frequency transmission systems with digital modulation is the phase jitter of the master oscillators of the receiver / transmitter, the so-called jitter. For the analysis of jitter effectively use the state diagram, since the eye diagram is not sensitive to it. If a jitter occurs in the path, then, as follows from
rice 7.22, there is an increase in the size of the points of the state diagram. To eliminate problems associated with the measurement of jitter data with the presence of jitter, additional measurements of the operating parameters of the master oscillators are usually made and troubleshooting is performed.
Measurements of parameters of modems.
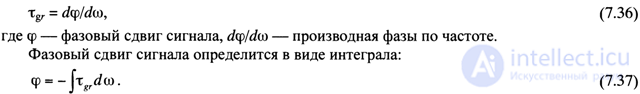
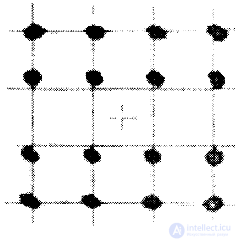
Для измерения параметров модема обычно используют анализаторы, обеспечивающие измерения сигналов в виде диаграмм состояния и глазковых диаграмм, которые дают наиболее полную информацию о структуре и изменениях параметров цифровой модуляции. In fig. 7.23 в качестве примера показаны диаграмма состояний и глазковая диаграмма для случая квадратурной амплитудной модуляции с 16-ю состояниями 16 QAM, из которых следует:
- размывание точек диаграммы состояний свидетельствует о влиянии шумов;
- искажение размера «глаза» свидетельствует о возможных нарушениях в работе цифрового канала (например, возникновение межсимвольных искажений).
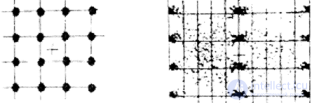
Fig. 7.23. Пример диаграммы состояний и глазковой диаграммы для случая AM с 16-ю состояниями 16 QAM
Рассмотрим следующие виды нарушений работы модемов и соответствующие им диаграммы.
1. Потеря синхронизации в цифровом канале.
Глобальная неисправность/отключение демодулятора или нарушение фазовой синхронизации могут привести к нарушению согласования между модулятором и демодулятором и пропаданию сигнала в системе передачи. В этом случае диаграмма состояний представляет собой случайное распределение сигналов по соответствующим уровням модуляции, «глаз» глазковой диаграммы полностью закрывается (рис. 7.24).
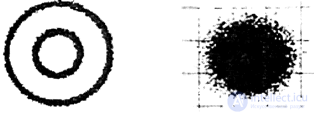
Fig. 7.24. Пример потери синхронизации в цифровом канале: диаграмма состояний представляет собой случайное распределение сигналов по соответствующим уровням модуляции, «глаз» глазковой диаграммы полностью закрывается.
2. Нарушение установки параметров уровня модуляции/демодуляции.
In fig. 7.25 показана диаграмма состояний, из которой следует, что при установлении уровней модуляции/демодуляции возникла несбалансированность по амплитуде сигнала. Изменения в диаграмме состояний могут свидетельствовать о нелинейностях модулятора или нарушении работы ЦАП.
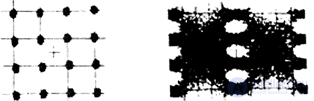
Fig. 7.25. Пример нарушения установки параметров уровня модуляции/демодуляции.
3. Нарушение ортогональности I и Q векторов демодулятора.
Одной из распространенных неисправностей в работе модема является нарушение работы демодулятора, когда векторы I и Q полярных координат демодулятора не строго ортогональны. Это приводит к несоответствию состояний ортогональной сетке координат на диаграмме состояний (рис. 7.26).
 Эта неисправность может сопровождаться или не сопровождаться ошибкой фазовой синхронизации в цепи восстановления несущей. В случае отсутствия ошибки результат воздействия этой неисправности на глазко-вую диаграмму сводится к закрыванию «глаза» на диаграмме по сигналу I и отсутствию какого-либо изменения на диаграмме Q. При наличии ошибки «глаза» обоих диаграмм будут закрыты. Необходимо отметить, что анализ одной только глазковой диаграммы не позволяет установить причину неисправности, поскольку эта диаграмма полностью совпадает с глазковой диаграммой при наличии высокого уровня аддитивных шумов в канале. Достоверное определение причины неисправности в этом случае может дать только диаграмма состояний. Устранение описанной неисправности требует подстройки демодулятора в части ортогональности сигналов I и Q. На диаграмме состояний рис. 7.27 отмечено наличие ошибки фазовой синхронизации в 2,3 градуса.

Fig. 7.27. Пример появления ошибки фазовой синхронизации.
Измерения параметров работы усилителей в составе радиочастотного тракта.
Основными измеряемыми параметрами работы усилителей в составе радиочастотного тракта являются:
- шумы, вносимые усилителями;
- параметры нелинейности усилительных участков.
Перегрузка по амплитуде может привести к переходу усилителя в нелинейный режим и, как следствие, резкому увеличению вероятности ошибки в цифровой системе передачи. Использование диаграмм состояний и глазковых диаграмм позволяет оценить причины снижения параметров качества радиосвязи (нелинейные искажения приводят к расплыванию точек диаграммы состояний и закрытию «глаза» глазковой диаграммы).

Comments
To leave a comment
GSM Basics
Terms: GSM Basics