Lecture
One of the most important components of product quality management in the production process is the quality control of manufactured products and the technological processes of their production. The most perfect and rational ways of organizing such control are based on the use of statistical methods.
When used in the production of high-performance process equipment, one of the most important requirements for the quality parameters of manufactured products is the requirement of homogeneity, characterized by a specified tolerance. To ensure this homogeneity, it is necessary to systematically monitor the quality of products, preventing sudden breakdown of equipment that could lead to a massive marriage * . However, systematic control cannot be continuous, since its labor intensity would exceed the labor intensity of manufacture. Such systematic control can be carried out using statistical methods that allow not only to control the quality of products * , but also to judge the quality of the technological process and regulate it.
The essence of statistical methods of control is that the conclusion about the quality of the manufactured products and the technological process is made according to the results of selective control of the parameters of the manufactured products. In order to identify violations during the process, it is necessary to periodically take samples (samples), measure their parameters and, depending on the measurement results, either continue the process (if no deviations are detected) or (if deviations are detected) stop it and perform adjustment .
The measurement data is entered into the control card and the location of the data in the control card makes a conclusion about the quality of the process, namely - the output of the controlled statistical characteristics beyond the regulatory boundary is a signal of the disorder of the process.
The control chart method is based on probability theory and mathematical statistics. In this case, proceed from the following main provisions.
In the production process it is impossible to get all the products of identical quality. Changes in production parameters that fluctuate within certain limits are called scattering (distribution) of parameters and reflect the regularities of a certain technological process. The scattering of parameters is caused by a complex of random and systematic causes that act in the production process and determine the errors of the technological process.
As practice shows, most of the technological parameters are distributed according to the law of normal Gaussian distribution: dimensions, volumes, temperature, hardness, mass, etc. There may be a uniform distribution. Less common is the distribution according to Maxwell's law, which reflects a one-sided distribution of parameters: beating, imbalance, non-perpendicularity, etc.
A group of objects united by a qualitative or quantitative trait is called a statistical aggregate . The items that make it up are called members of the population , the number of members forms the volume of the population .
The part of members of a statistical population selected from it to obtain information about the entire population is called a sample population (sample) . The number of members of the sample forms its volume. There are samples: small (<25) and large (> = 25).
On the basis of the law of large numbers, they say that if the general (statistical) population obeys a certain scattering law, then a sample with a sufficient amount obeys the same law and vice versa.
As you know, the main statistical characteristics of the normal distribution are:
 );
);  ).
). Taking a sample from the statistical population and calculating its statistical characteristics and , consider that they are estimates of the characteristics of the entire population, i.e.  0 and 0
The graph of the normal distribution reflects the change in the frequency of the hit of the measured value in the corresponding interval of values. In order to make a conclusion about the presence of a marriage in a controlled batch of objects, it is necessary to compare the practical dispersion zone of the measured parameter. ± 3 (99.73% of controlled items fall into it) with a tolerance field for this parameter  (fig. 8.7).
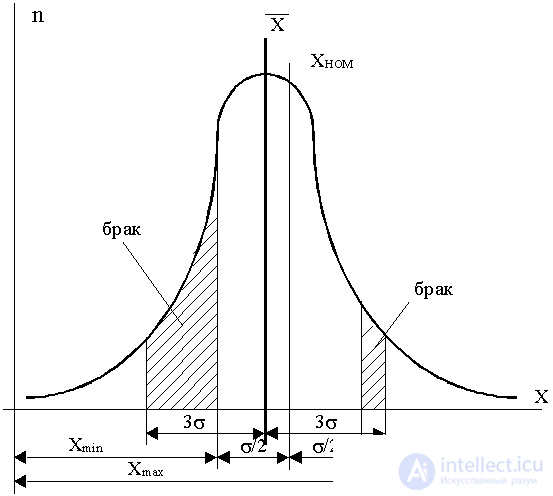
Fig. 8.7.
All products are suitable for which the controlled parameter X deviates from its nominal value X Mr. by no more than the tolerance / 2 (with symmetric tolerance field). The presence of defects is determined not only by the ratio of the width of the tolerance field and the range of scattering, but also by the magnitude of the shift in the mean value of the distribution relative to X nom .
Marriage can occur in three cases:
When building control charts, it is necessary to determine:
Control boundaries (control standards) are determined on the basis of the collection and statistical processing of data characterizing the normal state of the process.
The frequency of sampling or sampling is determined based on the distribution of the degradation time of the process in the previous period.
The size of the sample or sample is determined by the normative tables based on the statistical characteristics of the process, the required probability of detecting a defect and the adopted frequency of sampling.
Methods of statistical regulation of technological processes with the use of various control cards are standardized in the state standards of the Russian Federation, international standards and national standards of many countries.
In production practice, various types of control charts are used, differing in the nature of the data used. The most widely used are the following types:
- R - map); Map of arithmetic mean values and ranges. When building ( - R) - maps of the analyzed statistical characteristics of the controlled sample are the arithmetic average of the controlled parameter and its scope R, determined by dependencies:

R = X max - X min ,
where X i - the value of the i-th measurement of the monitored parameter; n is the number of measurements in the sample; X max and X min are the maximum and minimum values of measurements in the sample, respectively.
The obtained values of the characteristics of the sample are plotted on a control card consisting of two diagrams (Fig. 8.8). Four control limits are preliminarily plotted in the upper diagram of the diagram: Т в в and Т н - upper and lower technical limits, corresponding to the limits of the tolerance field; Р в and Р н - the upper and lower precautionary limits, which determine the permissible deviations of the arithmetic mean values of the parameter during the normal stable process. The values of the ordinates of these boundaries are calculated by dependencies:
P b = 0 + A · 0
P H = 0 - A · 0
where A - statistical coefficients depending on the sample size; 0 and 0 - statistical characteristics of the configured process.
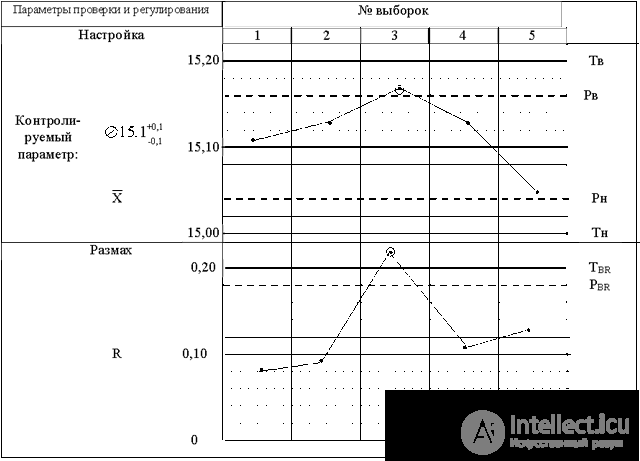
Fig. 8.8. Control ( - R) card.
In the lower span diagram, two control borders are plotted: T ВR and P ВR are the upper technical and precautionary boundaries for the span, the ordinates of which are determined by dependencies:
T B R = T in - T n = ;
P BR = (d n + 3T n ) 0 ,
where d n and T n are coefficients depending on the sample size.
In the production process, at a specified time, a random sample of a specified volume is taken from a batch of controlled items, the characteristics of the measured parameter are calculated and R and plotted on the corresponding diagrams in the form of points. The position of the control points on the charts makes a conclusion about the quality of products and technological process:
and R is within its warning limits, this means that the process is set up and there is no marriage; or (i) R is out of warning, but within technical boundaries, the process is upset, but this has not yet led to marriage. It is necessary to stop and adjust the process; or (i) R for technical limits means the appearance of a marriage. In this case, the process must be stopped and set up, and all products manufactured after taking the previous sample must be subjected to complete control. The fact that the averages go beyond the control limits indicates an offset of the center of adjustment, while the exit of the range beyond the constraints, even if the center of adjustment remains, indicates a loss of accuracy.
Map of medians and extremes. In the (M - X) card, the measure of the process is median  (the median value is ordered in ascending or descending series of numbers), and the measure of accuracy is the extreme values of the parameter X max and X min in the sample.
The control card contains one combined chart (Fig. 8.9), on which six control borders are plotted: T в and T н - upper and lower technical borders; P v and P nm are the upper and lower warning limits for the median; P VK and P NK - upper and lower warning limits for the extreme values of the sample. The values of the ordinates of these boundaries are calculated by dependencies:
P vm = 0 + K m · 0 ;
P nm = 0 - K m · 0 ;
P VK = 0 + K to · 0 ;
P nk = 0 - K to · 0 ,
where K m and K K are coefficients depending on the sample size.
Extreme values of the monitored parameter in the sample X max and X min (or all values) are plotted in points on the diagram, and the median value is marked with a cross (or other sign). .
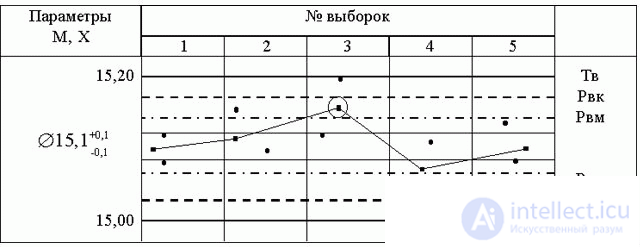
Fig. 8.9. Control (M - X) - map.
Based on the analysis of the obtained diagram, a conclusion is made about the quality of the process: If the median does not exceed the control limits Pвм and Pнм, and the extreme values of the sample fall outside the boundaries Pвк and Рнк, then the technological process is considered normal, and all products manufactured after the previous check are suitable . If one of the above conditions is violated, the process is considered to be unsatisfactory and requires adjustment, and if at least one of the values exceeds the technical boundaries Tv and Tn, all products manufactured between inspections are subject to complete control and sorting.
The considered methods of drawing up control charts are used in cases where the quality indicators can be expressed in quantitative data (dimensions, mass, hardness, etc.). In cases where controlled parameters are characterized by qualitative assessments (uniformity of staining, degree of contamination, etc.), another type of control card is usually used, which are called control cards based on an alternative feature ( P - cards ). In such cases, the quality is determined by two ratings: "quality" and "poor quality." In the process of control, the number of defective items in the sample is calculated, the proportion (percentage) of the defective product is determined and its value is plotted on the control card, which is preliminarily marked with the limit corresponding to the allowable fraction of defective products. If the actual proportion of defective items in the sample exceeds the allowable defect value, then the process needs adjustment.
C - the card differs from the P-card in that it is used to control the number of defects, for example, the number of scratches on the surface of the product, etc. The total number of defects in the sample is calculated, compared with the permissible one, and a conclusion is made about the quality of the manufactured products and the quality of the technological process.

Comments
To leave a comment
Management
Terms: Management