Lecture
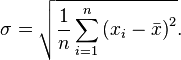
Standard deviation (synonyms: standard deviation , standard deviation , quadratic deviation ; close terms: standard deviation , standard variance ) - in the theory of probability and statistics, the most common dispersion of values of a random value relative to the math value relative to maternal mathematics For limited arrays of samples of values, the average arithmetic aggregate of samples is used instead of the expectation.
Standard deviation is measured in units of measurement of the random variable itself and is used in calculating the standard error of the arithmetic average, in constructing confidence intervals, in statistical testing of hypotheses, in measuring the linear relationship between random variables. Defined as the square root of the variance of the random variable.
Standard deviation:
Standard deviation (estimate of the standard deviation of a random variable x relative to its expectation based on an unbiased estimate of its variance):
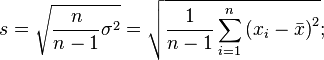
Where  - dispersion;
  - i- th element of the sample;
  - sample size;
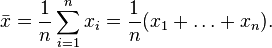
  - arithmetic average of the sample:
It should be noted that both estimates are biased. In the general case, an unbiased estimate cannot be constructed. However, an estimate based on an estimate of the unbiased variance is consistent.

Three Sigma Rule (  ) - almost all values of a normally distributed random variable are in the interval
 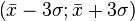 . More strictly, with approximately 0.9973 probability, the value of a normally distributed random variable lies in the specified interval (provided that
  true, not received as a result of processing the sample).
If the true value unknown then you should use not  and s . Thus, the three sigma rule is converted to the three s rule.
The large value of the standard deviation shows a large scatter of values in the presented set with the average value of the set; a small value, respectively, indicates that the values in the set are grouped around the mean.
For example, we have three numerical sets: {0, 0, 14, 14}, {0, 6, 8, 14} and {6, 6, 8, 8}. For all three sets, the mean values are 7, and the standard deviations, respectively, are 7, 5, and 1. For the last set, the standard deviation is small, since the values in the set are grouped around the mean; the first set has the largest value of the standard deviation - the values inside the set strongly differ from the average value.
In a general sense, the standard deviation can be considered a measure of uncertainty. For example, in physics, the standard deviation is used to determine the error of a series of consecutive measurements of a quantity. This value is very important for determining the plausibility of the phenomenon being studied in comparison with the predicted theory value: if the average value of the measurements differs greatly from the predicted theory values (a large value of the standard deviation), then the values obtained or the method of their obtaining should be rechecked.
In practice, the standard deviation allows us to estimate how much the values in the set can differ from the mean.
Suppose there are two cities with the same average maximum daily temperature, but one is located on the coast and the other on the plain. It is known that in cities located on the coast, many different maximum daytime temperatures are lower than in cities located within the continent. Therefore, the standard deviation of the maximum daytime temperatures of the coastal city will be less than that of the second city, despite the fact that they have the same average value, which in practice means that the probability that the maximum air temperature of each particular day in a year will be stronger differ from the average value, above the city, located inside the continent.
Suppose that there are several football teams that are evaluated by a certain set of parameters, for example, the number of goals scored and missed goals, scoring chances, etc. It is most likely that the best team in this group will have better values for more parameters. The smaller the team’s standard deviation for each of the presented parameters, the more predictable is the result of the command, such commands are balanced. On the other hand, a team with a high standard deviation is difficult to predict the result, which in turn is explained by an imbalance, for example, a strong defense, but a weak attack.
The use of the standard deviation of the parameters of the team allows in one way or another to predict the outcome of the match between two teams, assessing the strengths and weaknesses of the teams, and hence the chosen methods of struggle.
In technical analysis, the standard deviation is used to build the Bollinger lines, to calculate the volatility.

Comments
To leave a comment
Discrete Math. Set theory. Graph theory. Combinatorics.
Terms: Discrete Math. Set theory. Graph theory. Combinatorics.