Lecture
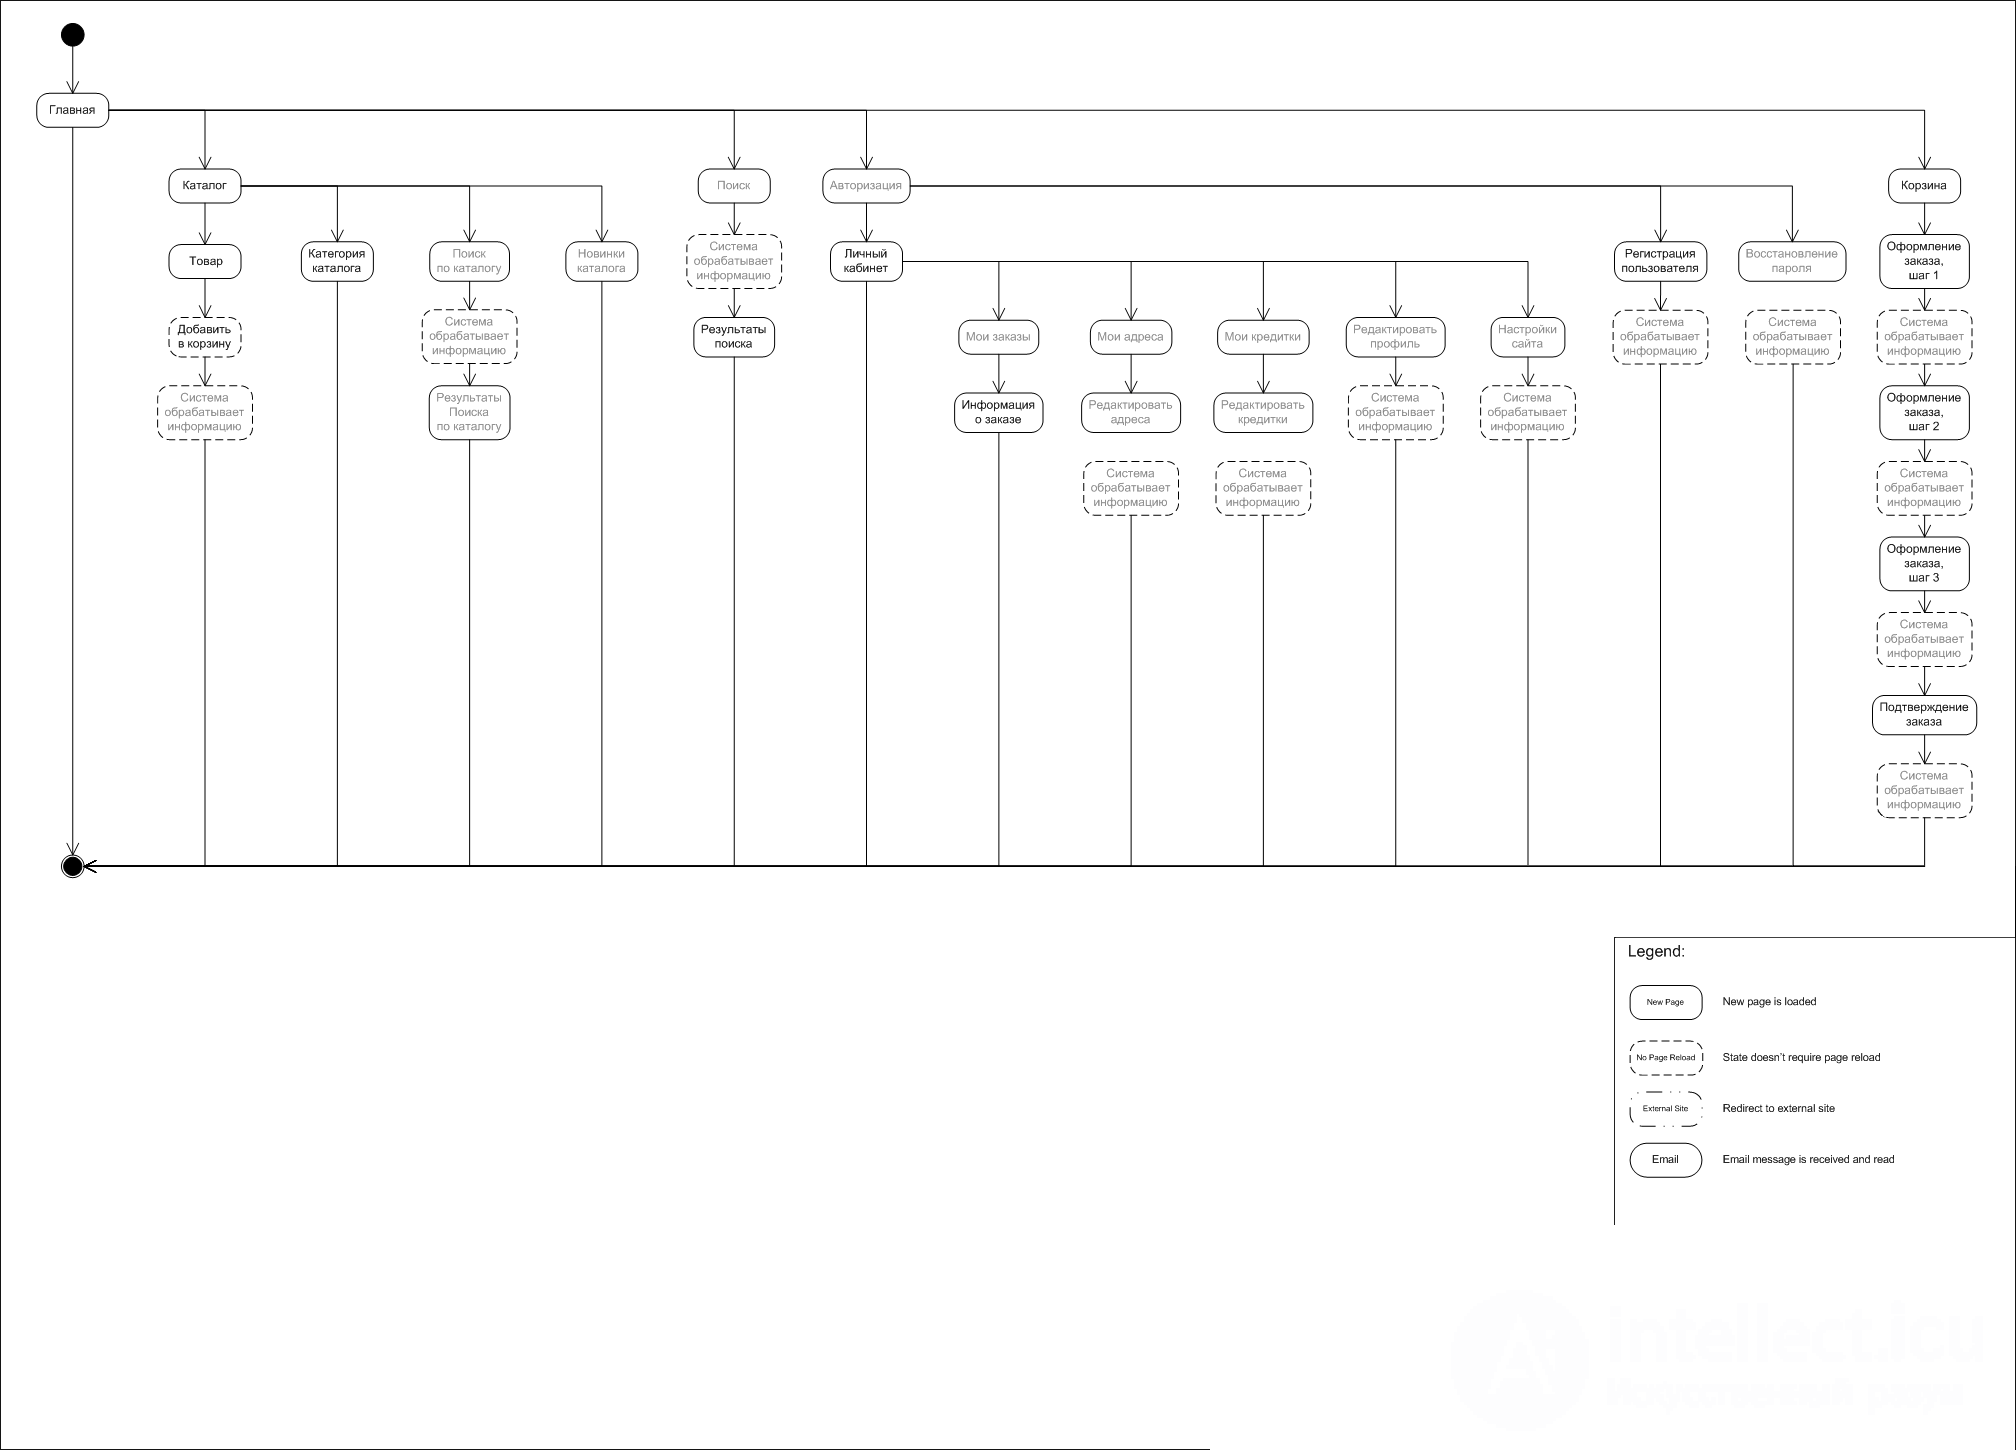
Page conversion charts are the patterns of user experience with system functionality. This diagram shows how the user performs one of their tasks, moving from page to page. In contrast to the site map and navigation scheme, the transition diagrams between pages take not the entire system, but its specific module and draw the process of the user working with him in all the details. In addition, if hierarchical relations “section / page” are important in the site map and navigation scheme, then the described diagrams concentrate on the sequence of transition between them.

Five stages, during which the collection of requirements for the product, design and design of its interface.

Three stages in which an existing product is analyzed and recommendations are made to improve its interface.

Comments
To leave a comment
design software UI and Web design
Terms: design software UI and Web design