Lecture
Links between steps in the algorithm can be represented as a graph. For example, for the algorithm for ordering numbers discussed above, the graph is shown in Fig. 6.1.
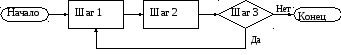
Fig. 6.1
Such a graph, in which the vertices correspond to the steps, and the edges - transitions between the steps, is called the flowchart of the algorithm. Its vertices can be of two types: vertices from which one edge comes out (they are called operators), and vertices from which two edges go out (they are called logical conditions, or predicates). In addition, there is a single end operator, from which no edges come out, and a single start operator. An important feature of the flowchart is that the links that it describes do not depend on whether the steps are elementary or are independent algorithms - blocks . The ability to “unlock” the algorithm is well known in programming and is widely used there: a large algorithm is divided into blocks that can be distributed for programming to different persons. For a given block, it does not matter how the other blocks are arranged; to program a block, it is enough to know where all the initial information lies, what the form of its presentation is, what the block should do and where to write the result.
With the help of flowcharts, it is possible, on the contrary, to combine several algorithms, considered as blocks, into one large algorithm. In particular, if the A1 algorithm, which calculates the function f 1 ( x ), is connected to the A2 algorithm, which calculates the function f 2 ( x ) (Fig. 6.2), and the result for A1 is the result A1, then the resulting block diagram sets an algorithm that calculates f 2 ( f 1 ( x )), i.e. the composition f 1 and f 2. Such a combination of algorithms is called a composition of algorithms.
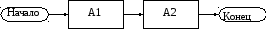
Fig. 6.2
The difference between the description of the algorithm and the process of its implementation is clearly visible on the flowchart. Description is a graph; the implementation process is the path in the graph. Different paths in the same graph arise with different data that create different logical conditions at branch points. The lack of convergence means that in the course of the calculation no conditions leading to the end appear, and the process follows an endless path (loops).
For all the clarity of the language of flowcharts, one should not, however, overestimate its capabilities. It is rather rude and reflects connections only on management (what to do at the next moment, that is, to which block to transfer control), and not on information (where to take initial data to this block). For example, rice. 5.2 with a disclaimer regarding the data, it represents the calculation of f 2 ( f 1 ( x )), but it could also depict the sequential calculation of two independent functions f 1 (5) and f 2 (100), the order of which is insignificant. The flowcharts contain no information about the data, or about the memory, or about the used set of elementary steps. In particular, we must bear in mind that if there are no cycles in the flowchart, this does not mean that there are no cycles in the algorithm (they can be in some non-elementary block). Essentially, flowcharts are not a language, but a means, however, very convenient, for one purpose - the description of the determinism of the algorithm. It is widely used with one modification: the conditions, that is, the branching points, can be not only binary, but also multi-valued; it is only important that exactly one of the possible answers be true. Examples of such conditions: a) x <O, x = 0, x > 0; b) x <5, 5 < x <20, x = 20, x <20.

Comments
To leave a comment
Finite state machine theory
Terms: Finite state machine theory