Lecture
When calculating power sources, any radio device or communication station is represented by active equivalent with resistance

where U 0 - the constant component of the voltage,
I 0 - load current.
Real load is usually non-linear, therefore differential load resistance is often used:
 .
. Usually R N ≠ R ND , therefore, the calculations of the VIP are valid only for the nominal mode and this is a source of error in the calculations of the indicators of rectifying devices.
The main characteristic of any energy device is its efficiency, which is equal to the ratio of active power output (Pout) and input (P - power consumed *** from the primary network):

where Pout = P 0 = U 0 × I 0 is the output power.
If the primary network is DC, then P = U BX × I BX . If the primary AC network, the power consumed *** from the network at a harmonic current is equal to:
S = U × I - total power Pout = P 0 = U 0 × φ
P = U × I × cos φ - active power
Q = U × I × sin φ is the reactive power, where U, I are the effective values of voltage and current. Fair power triangle  (picture 1):

Figure 1 - Power Triangle
If the current is non-harmonic, then the active power is consumed *** only at the frequency that coincides with the frequency of the mains voltage. Here another component appears at full power - the power of distortion (T)  ,
,
but the active power is consumed *** only by the first harmonic P = U × I 1 × cos 1 , where I 1 is the effective value of the first harmonic of the current and the angle of shift of this harmonic is φ 1 .
Total power (S) characterizes the limiting possibilities of the energy source. Power factor is the ratio 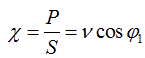 , (1.2)
Where  - coefficient of current distortion (I 1 - effective value of the first harmonic; I - effective value of all harmonics of non-sinusoidal current). With harmonic signals S = P only in resistive circuits. Real circuits always have reactivity and non-linearity, therefore x≤1. In the energy sector take special measures to increase x. The International Electrotechnical Commission (IEC), as early as 1992, put into operation the IEC-555-2 standard, according to which any device that consumes more than 300 watts of power from a network must have a power factor equal to one. This is only possible if there is an active power factor corrector (CMC) at the input. In 2001, the new standard IEC – 1000–3–2 was adopted, in which the power level was reduced to 200 watts, as the number of low power consumers is growing. Therefore, any electrical products, entering the international market and connected to the AC network, must have an active input resistance.
The form of the output voltage of the VU in the general case contains a constant (useful) component and a variable component (ripple). It is shown in Figure 2.
The coefficient of pulsations is the ratio of the amplitude of the first harmonic of the pulsations to the constant component U 0 , although it can be determined from any harmonic that may turn out to be larger than the first.
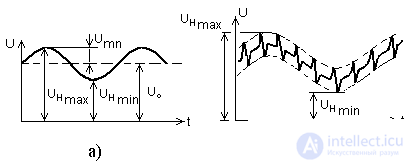
Figure 2 - Rectifier output voltage
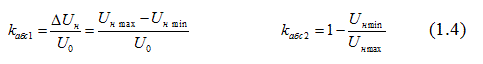
Representing the rectified voltage next to Fourier - the sum of the constant component U 0 and n harmonics with amplitudes U mn , find the voltage ripple factor:  , (1.3)
The constant component of U 0 - the beneficial effect of straightening. Pulsations U mn is a harmful component. In the case of a complex form of pulsations, not the first harmonic, but a harmonic with a higher number, can have the largest value, although usually kP means precisely the first harmonic, which is used in all calculations and is given in the technical documentation for the equipment.
In modern rectifiers using pulsed conversion methods, the shape of the pulsations is significantly different from the harmonics (Fig. 2). The consumer is usually not interested in which of the harmonics is greater and which is less. He is interested in the general scope of pulsations or the so-called absolute pulsation coefficient (kabs), which can be calculated using different formulas, for example:
If, for example, to set U 0 = 10 V, U m1 = 1 V, then we find 
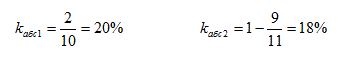
It can be seen that the absolute ripple factor is twice as large in magnitude and objectively reflects the pulsations on the load, although it is precisely the first harmonic pulsations that are indicated in all normative documents. Therefore, the coefficient of pulsation must be treated very carefully.
In order to estimate the noise penetrating the telephone communication channels through the power supply circuits, it is necessary to take into account not only the amplitude but also the frequency of the interference. This is due to the uneven sensitivity of the human ear in the sound range. Therefore, the concept of the psophometric coefficient a K is introduced, whose dependence on frequency is shown in Figure 3.
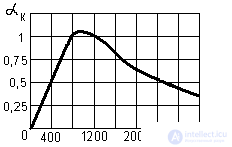
Figure 3 - Psophometric coefficient
At a frequency of f = 800 Hz, a k = 1. The relative influence of harmonics with other frequencies is characterized by the magnitude of the psophometric coefficient.
The effective value of the psophometric voltage ripple U PSF at the output of the rectifier is determined by the expression:
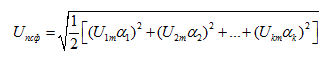
where a k is the coefficient of the corresponding harmonic, U km are the amplitudes of the corresponding harmonics of the rectified voltage.
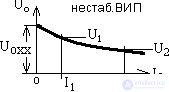
The external characteristic of the secondary power source is the dependence of the voltage on the load on the load current: U 0 = f (I 0 ). The secondary power supply is usually represented by a U 0xx (no-load) constant-voltage generator with an internal resistance R out . This diagram is shown in Figure 4.

According to this scheme, it is possible to determine the voltage at the power supply terminals: U 0 = U 0xx - I 0 R out . A typical external characteristic of a power source is shown in Figure 5 and usually has a falling character.
The voltage drop is determined by the output impedance of the power source, so the external characteristic can determine its output impedance:
 , (13)
 This resistance is usually non-linear, so it is found at a given operating current. In a stabilized power supply, the output impedance can be quite small, and then the external characteristic takes the form shown in Figure 6.

The output impedance of the power source significantly affects the operation of electronic equipment. If several blocks are powered from one source (a widespread practice), then the dependence of the output voltage on the source current at R out ≠ 0 leads to an electrical connection between several loads. This situation is illustrated by the equivalent circuit shown in Figure 7.
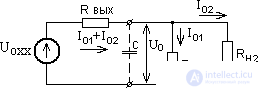
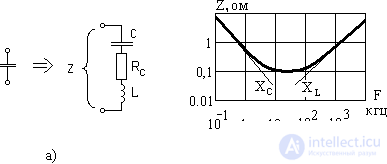
The change in the current of one of the loads I 01 or I 02 leads to a change in U 0 and R out of the power supply plays the role of resistance, which is the result of parasitic current feedback. To eliminate it, use a large capacitor C at the output of the power supply. Its value can be calculated based on the condition:
 , (14)
 where ω n is the frequency of change of the load current.
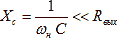
With pulsed load currents, this condition must be fulfilled for a wide range of frequencies, but there are no ideal capacitors. A real capacitor can be represented by an equivalent replacement circuit, shown in Figure 8.
Here R c is the loss resistance depending on the loss tangent of the dielectric used, L is the inductance of the leads and the inertia of the dielectric. The dependence of the impedance Z on the frequency is of a resonant nature. The resonance frequency depends on the type and design of the capacitor and varies widely from 2 GHz for ceramic smd capacitors to tens of kilohertz for electrolytic capacitors. For example, for a capacitor K50-33 with a voltage of 63 V and a capacitance C = 4700 μF, the impedance modulus lies within Z = 0.03 ... 0.1 Ω in the frequency range 10 kHz ... 1 MHz. [13]. The value of the resistance of an ideal capacitor is equal to:
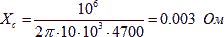 (15)
(15) That is, the real resistance of the capacitor at a frequency of 10 kHz exceeds the theoretical value of the resistance X s by an order of magnitude. Therefore, in the circuits of devices sensitive to interference, parallel to the electrolytic capacitor, a film or ceramic capacitor of small capacity is installed, which has a greater operating frequency band.
Energy devices of the same purpose are compared with each other in specific mass-volume parameters with the dimension: W / dm³ and W / kg (sometimes kg / W). The dimensions of any electrical device are determined either by the required surface of the heat conductor (VT), or by the structural volume necessary for positioning the parts V to . The use of integrated and hybrid-film technology for manufacturing diodes, transistors, resistors, chokes and other parts increases their load factor, i.e. the current density j (A / mm²) and the conversion frequency increase, which leads to a decrease in the mass and volume of the structure Vc. On the other hand, an increase in the load factor leads to an increase in losses; consequently, the required “thermal” volume (Vt) also increases. This position is illustrated by the graph shown in Fig. 7, where the integral parameter — frequency f, current density j, induction B — is plotted on the abscissa.
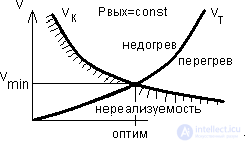
It can be assumed that increasing the frequency, you can reduce the volume of the structure, but this increases the minimum thermal volume (a powerful transistor is placed on the radiator!). Therefore, it makes no sense to go beyond the optimum point. Getting to this point at the design stage of the system can only be random, since the task is multiparameter. Any deviation from it in one direction or another is the basis for optimizing operating modes in order to increase the power density and efficiency of the secondary source.
Modern rectifiers (VBV - pulse) operate at the optimum point and are characterized by a specific power of 400 ... 600 W / dm³ at a conversion frequency of 50 ... 100 kHz. Classic rectifiers operating at an industrial frequency of 50 Hz have a specific power of 7 ... 10 W / dm³.

Comments
To leave a comment
Power supplies for electronic equipment
Terms: Power supplies for electronic equipment