Lecture
Clustering task
In module 1 of this lecture course, training was considered by the teacher when the neural network learns to classify samples in accordance with the instructions: the target output image provides the network information about which class should learn to assign the input sample. When teaching without a teacher, there are no such instructions, and the network conducts clustering of samples (i.e., dividing them into groups) independently. The separation of samples into clusters must meet the following two requirements:
• Samples within a single cluster should be somewhat similar.
• Clusters, similar in some sense, should be located close to one another.
A measure of the proximity (or similarity) of two points p and q is the square of the Euclidean distance between them, calculated by the formula:
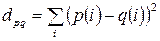 . (8.1)
If we consider the centroid p j for cluster j, then for the data in Figure 8.1 the decision on which cluster the sample x belongs to is determined by the value:
 (8.2)
(8.2)
Cluster centroid is a vector obtained by averaging vectors in a cluster.
The clustering algorithm is a statistical procedure for separating groups from an existing data set. There are many clustering algorithms of various levels of complexity. One of the simplest approaches is to assume the existence of a certain number of clusters and arbitrarily choose the coordinates for each of the prototypes — typical representatives of the cluster. Then each vector from the data set is associated with the closest prototype, and the centroids of all vectors associated with the original prototype become new prototypes.
Sometimes it is convenient to represent a cluster with several prototypes in order to get a more detailed description of the data. To recognize clusters that are part of a larger cluster, it is necessary to know the position of all prototypes relative to each other. One of the problems with the application of clustering algorithms is the choice of the optimal number of clusters. If the number of clusters is chosen too small, some important characteristics of the data may be missed, and if there are too many clusters, we will not get any effective summary information about the data (it may even happen that each sample creates its own cluster). We can formulate some basic properties of an ideal clustering algorithm;
• automatic determination of the number of cluster prototypes;
• comparison of prototypes;
• presentation of the characteristic features of the prototype.
In practice, none of the known clustering algorithms has the first of these properties. The non-management learning neural network performing clustering is a self-organizing feature map that T. Kohonen proposed in the early 1980s.
In self-organization maps, neurons are placed in lattice sites, usually one- or two-dimensional. Maps of higher dimensions are also possible, but are used quite rarely. During the competitive process, neurons are selectively tuned to different input images (pathogens) or classes of input images. The positions of the neurons thus tuned (i.e. the winning neurons) are ordered relative to each other so that a meaningful coordinate system is created on the grid. The spatial position of the output neurons in the topographic map corresponds to a specific region of the characteristics of the data extracted from the input space.
The development of self-organization maps as neural models is due to the following distinctive feature of the human brain: it is organized in such a way that the individual sensory inputs appear to be topologically ordered computational maps in certain areas of it. In particular, sensory inputs, such as the nerve endings of a tactile system, vision, and hearing, are mapped onto various contours of the cerebral cortex. Thus, computational mapping is a building block in the information processing infrastructure of the nervous system. The computation map, in turn, is formed by an array of neurons, which are several differently configured processors or filters, which in parallel receive information from different sensors.
Figure 8.1 shows the block diagrams of the two models. In both cases, the output neurons are organized in a two-dimensional lattice. This type of topology ensures that each neuron has many neighbors. These models differ from each other in the way the input images are specified.
The Wilshaw-van der Malsburg model was proposed in a paper on biological fundamentals that explained the imaging of the retina of the eye on the visual cortex. In particular, there are two interconnected two-dimensional lattices of neurons, where one is projected onto another. The first lattice is represented by presynaptic (input), and the second - by postsynaptic (output) neurons. The postsynaptic lattice uses an excitatory mechanism of close range, as well as a long-range inhibitory mechanism. These two mechanisms are local in nature and extremely important for self-organization. The lattices are connected by variable Hebbovsky-type synapses. Postsynaptic neurons do not belong to the “winner takes all” type - instead, a threshold is used to ensure that only a few postsynaptic neurons are active at any given time. Moreover, in order to avoid an unlimited increase in synaptic weights, which can lead to system instability, the total weight associated with each postsynaptic neuron is limited to a certain value. Thus, the growth of a single synaptic neuron weight leads to an automatic decrease in the rest. The basic idea of the Wilshaw-van der Malsburg model is that adjacent presynaptic neurons must communicate with adjacent postsynaptic cells in order to present information. Thus, self-organization leads to a topologically ordered mapping. It should be noted that the Wilshaw-van der Malsburg model is only suitable for representing mappings in which the dimensions of the input and output signals are equal.
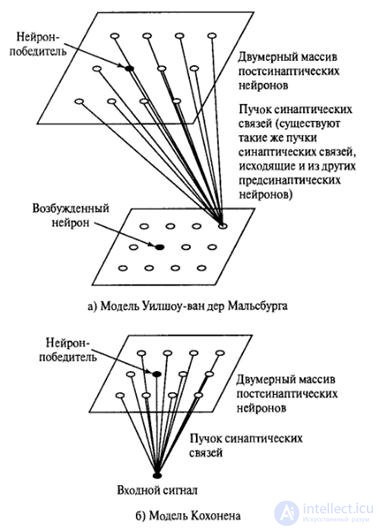
Figure 8.1 - INS models of self-organization.
The second model was proposed by T. Kohonen. It does not concentrate on neurobiological details. This model extracts the essential features of computational maps of the brain and remains computationally interpretable. The Kohonen model is more general than the Wilshaw-van der Malsburg model in the sense that the dimensions of the input and output signals differ.
The main purpose of Kohonen’s self-organization maps is to convert incoming signal vectors of arbitrary dimensionality into a one- or two-dimensional discrete map. In this case, such a transformation is carried out adaptively, in a topologically ordered form. Figure 8.2 shows a schematic diagram of a two-dimensional neuron lattice. All neurons of this lattice are connected with all nodes of the input layer. This network has a direct propagation structure with one computational layer consisting of neurons arranged in columns and rows.
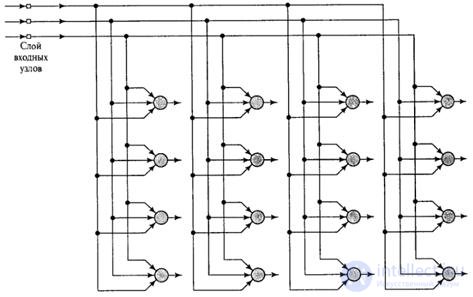
Figure 8.2 - Two-dimensional map of self-organization with a rectangular grid.
Also use a triangular grid or a random arrangement of neurons. Their cooperation depends on the location of the neurons (see below).
The algorithm responsible for the formation of self-organizing maps begins with the initialization of the network's synaptic weights. This usually occurs by assigning synaptic weights to small values generated by a random number generator. With this formation, the feature map does not initially have any order of features. After that, during each era, the network will go through the following stages of training.
1. Competition. Neurons in the network compete with each other for the right to be activated. The neuron-winner is declared that neuron, for which the Euclidean distance between the weight vector and the input signals vector was minimal, as in formula 8.2.
2. Cooperation. The winning neuron forms a topological area on the neuron array corresponding to the characteristics of the input vector.
3. Adaptation. Adjustments of synaptic weights are made so that the response of the winning neuron to the subsequent arrival of similar examples is enhanced.
Cooperation and adaptation can occur in accordance with one of two principles:
- the winner neuron takes everything: the activity of all neurons, except the winner i * neuron, is suppressed and only the winner neuron adjusts its weights:
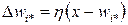 ;
;
- the winner's neuron does not take everything away: the neighborhood function is entered into the expression, which is equal to 1 for the winner's neuron and reduces the value to 0 as the distance from the winner's neuron to a specified radius decreases:
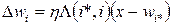 .
.
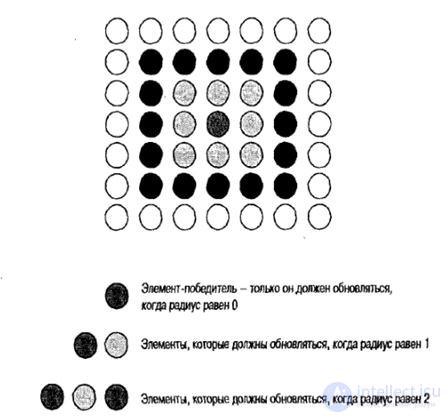
Figure 8.4 - Selection of items to update.
The parameters of the neighborhood function and the learning rate depend on time. Usually, with each new epoch, the radius of the circle around the winning neuron decreases from 2/3 of the radius of the entire network to 0.

Comments
To leave a comment
Intelligent Information Systems
Terms: Intelligent Information Systems