Lecture
UML (Unified Modeling Language) - a unified modeling language.
1. UML is a language
UML is a formal and artificial language. It is artificial because it has authors: Grady Butch, Ivar Jacobson and James Rumbaugh (at the same time, the development of UML continues unabated, which puts it on a par with natural languages). It can be called formal because there are rules for its use (although the description of the UML also contains explicitly informal elements). Another nuance: UML is a general-purpose graphical modeling language (i.e., it can be used to design anything from simple swings, to a complex hardware-software complex or even a spaceship ***), designed for specification, visualization, design and document all artifacts created during development.
Like any formal artificial language, UML contains the following parts:
2. UML is a modeling language.
Moreover, object-oriented modeling. There are two whole words in English - modeling and simulation, which both translate as "modeling", although they mean different things. Modeling involves creating a model that only describes the object, and simulation involves getting some additional information about the object using the created model. UML in the first place - the modeling language in the first sense, that is, a means of constructing descriptive models. Although as a means of simulating it, too, can be used.
3. UML is a unified modeling language.
UML is not the first modeling language. By the time of its appearance there were dozens of others, differing in the system of notation, degree of universality, ways of application. In the literature, one can find a description of the era "before UML" as "war of the methods" of modeling, none of which "fell short" to the level of the industrial standard. In the beginning of the 90s of the last century, the three largest specialists in this field, the authors of the most popular methods, decided to unite their efforts precisely with the aim of unifying their (and not only their) developments in accordance with the social order. The authors of UML, with the support and assistance of the entire international programming community, were able to bring together (unify) most of what was known before them.
So, UML is an artificial language that has some features of a natural language, and a formal language that has features of an informal one. A UML model is a collection of diagrams.
A diagram is a graphical representation of a set of elements. Usually depicted as a graph with vertices (entities) and edges (relations). There are many examples of diagrams: block diagram, equipment installation diagram, tree of files.
When designing software using diagrams, you can visualize the system from various points of view. One of the diagrams, for example, may describe the user’s interaction with the system, the other - the change in the system states during its operation, the third - the interaction between the system elements. A complex system can and should be presented as a set of small and almost independent model diagrams, and none of them is sufficient to describe the system and get a complete picture of it, since each of them focuses on a particular aspect of the system’s functioning and expresses different level of abstraction. In other words, each model corresponds to a certain, particular point of view on the system being designed. No single diagram is a model. Diagrams are just a model visualization tool. and these two concepts should be distinguished. Only a set of diagrams constitutes a model of the system and describes it most fully, and not one diagram taken out of context. Consider in more detail the types of charts.
Structural charts:
Behavior diagrams:
Interaction diagrams:
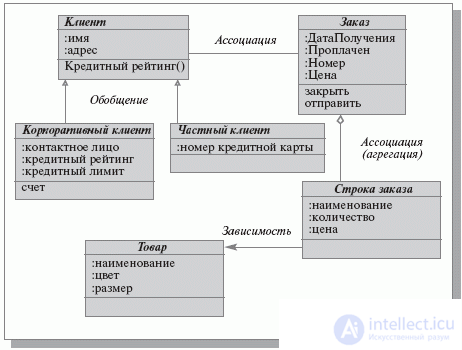
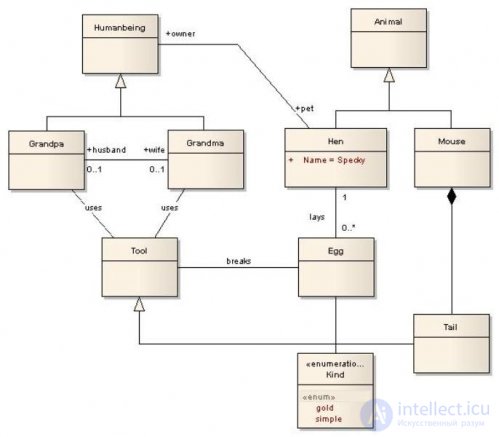
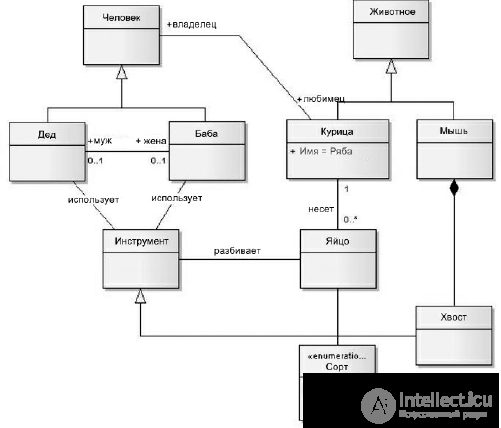
Class diagram
A class diagram is a static structural diagram that describes the structure of a system; it demonstrates the classes of a system, their attributes, methods, and dependencies between classes. This is one of the most commonly used types of UML diagrams. Typically, the creation of a class diagram marks the end of the analysis process and the beginning of the design process.
A class diagram consists of a set of elements that collectively reflect declarative knowledge of the subject area. This knowledge is interpreted in the basic concepts of the UML language, such as classes, interfaces, and relationships between them and their component components. At the same time, individual components of this diagram can form packages to represent a more general system model. If the class diagram is part of a package, then its components must match the elements of the package, including possible references to elements from other packages.

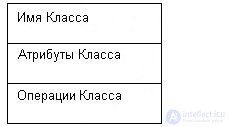
Class
A class in the UML language is used to designate a set of objects that have the same structure, behavior, and relationships with objects from other classes. The class in the diagram is depicted as a rectangle, divided by horizontal lines into three parts. The first part indicates the name of the class. The second part contains a list of class attributes that characterize one or another object of this class in the domain model. The third part contains a list of operations that reflect its behavior in the domain model.
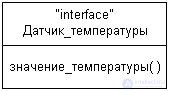
Interface
The interface is not only and not so much a group of object operations. The interface reflects the external manifestations of the object, shows how it interacts with it, hiding other details that are not related to the interaction process. The object is a separate instance of a class that is created at the stage of program execution. It has its own name and specific attribute values. For the image of the interface, a special graphic symbol is used - a class rectangle with a keyword or stereotype "interface". In this case, the attributes section of the rectangle is missing, and only the operations section is indicated.
The interface is always implemented by some class, which in this case is called a class that supports the interface. The same object can have several interfaces. This means that the class of this object implements all the operations of these interfaces.
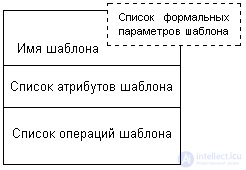
Template
A template (template) or a parametrized class (parametrized class) is intended to indicate a class that has one (or more) non-fixed formal parameter. It defines a whole family or set of classes, each of which can be obtained by associating these parameters with real values. Typically, the template parameters are the types of class attributes, such as integers, enumerations, an array of strings, etc. In a more complicated case, the formal parameters may represent class operations.
Graphically, the pattern is represented by a rectangle, to the upper right corner of which a small rectangle of dotted lines is attached, a large rectangle can be divided into sections, similar to the designation for a class. The upper rectangle indicates the list of formal parameters for those classes that can be derived from this template. In the upper section of the template, its name is recorded according to the rules for recording names for classes.
Relationship between classes
In addition to the internal structure or structure of classes, various relationships between classes are indicated on the corresponding diagram. At the same time, the set of types of such relations is fixed in the UML language and predetermined by the semantics of these types of relations. The basic relationships or relationships in the UML language are:
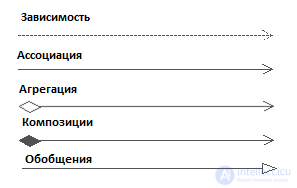
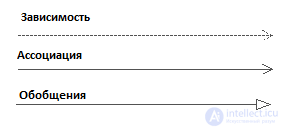
Dependency ratio
A dependency relation generally indicates some semantic relation between two elements of a model or two sets of such elements, which is not a relation of association, generalization or realization. It concerns only the elements of the model itself and does not require a multitude of separate examples to explain its meaning. The dependency relationship is used in such a situation, when some change in one model element may require a change in another model element dependent on it.
Association relation
Отношение ассоциации соответствует наличию некоторого отношения между классами. Данное отношение обозначается сплошной линией с дополнительными специальными символами, которые характеризуют отдельные свойства конкретной ассоциации. В качестве дополнительных специальных символов могут использоваться имя ассоциации, а также имена и кратность классов-ролей ассоциации. Имя ассоциации является необязательным элементом ее обозначения. Если оно задано, то записывается с заглавной (большой) буквы рядом с линией соответствующей ассоциации.
The generalization relationship The generalization relationship is a common taxonomic relationship between the more common element (parent or ancestor) and the more particular or special element (child or descendant). This relationship can be used to represent relationships between packages, classes, use cases, and other UML elements.
As applied to the class diagram, this relationship describes the hierarchical structure of classes and the inheritance of their properties and behavior. It is assumed that the descendant class has all the properties and behavior of the ancestor class, and also has its own properties and behavior that are absent in the ancestor class. In the diagrams, the relation of generalization is indicated by a solid line with a triangular arrow at one of the ends. The arrow points to a more general class (ancestor class or superclass), and its absence indicates a more special class (descendant class or subclass).
Aggregation ratio
An aggregation relationship takes place between several classes if one of the classes is an entity that includes other entities as its component parts. This relationship is of fundamental importance for describing the structure of complex systems, since it is used to represent system interrelations of the "part-whole" type. Expanding the internal structure of the system, the aggregation relation shows what components the system consists of and how they are interconnected.
Composition ratio
The composition relationship is a special case of the aggregation relationship. This relationship serves to highlight a special form of the "part-whole" relationship, in which the component parts are in a certain sense within the whole. The specificity of the relationship between them lies in the fact that parts cannot act in isolation from the whole, that is, with the destruction of the whole, all its component parts are destroyed.
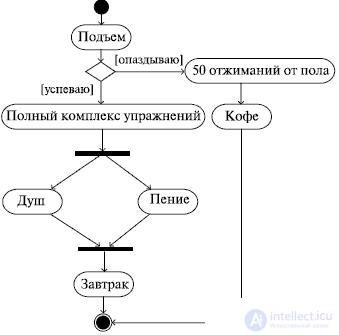
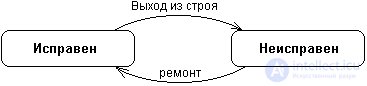
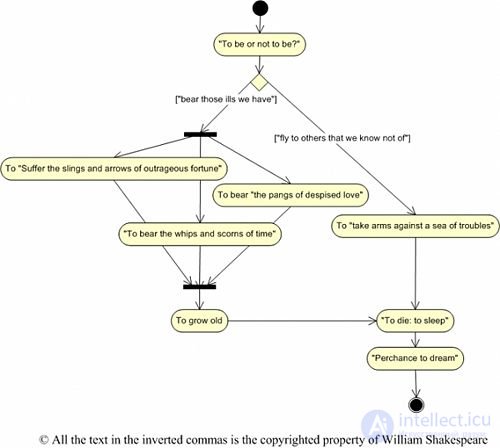
State diagram
In contrast to other diagrams, the state diagram describes the process of changing the states of only one class, more precisely, one instance of a particular class, that is, it models all possible changes in the state of a specific object. In this case, a change in the state of an object can be caused by external influences from other objects or from outside.
The main purpose of this diagram is to describe the possible sequences of states and transitions, which together characterize the behavior of the model element during its life cycle. The state diagram represents the dynamic behavior of entities, based on the specification of their response to the perception of some specific events.
Although state diagrams are most often used to describe the behavior of individual instances of classes (objects), they can also be used to specify the functionality of other components of models, such as use cases, actors, subsystems, operations, and methods.
The state diagram is essentially a special type of graph that represents some automaton. The concept of an automaton in the context of UML has a rather specific semantics based on the theory of automata :). The vertices of this graph are states and some other types of automaton elements (pseudostates), which are represented by the corresponding graphic symbols. Arcs of a graph are used to denote transitions from state to state. State diagrams can be nested into each other, forming nested diagrams of a more detailed representation of the individual elements of the model.
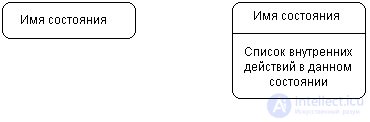
condition
In the UML language, a state is an abstract metaclass used to simulate a particular situation during which a certain condition occurs. The state can be specified as a set of specific values of the attributes of a class or object, while changing their individual values will reflect the state change of the modeled class or object.
It should be noted that not every attribute of a class can characterize its state. As a rule, only those properties of system elements that reflect the dynamic or functional aspect of its behavior are of value. In this case, the state will be characterized by some invariant condition, which includes only attributes and values that are significant for the behavior of the class.
The state on the diagram is depicted as a rectangle with rounded vertices. This rectangle, in turn, can be divided into two sections by a horizontal line. If only one section is specified, then only the state name is recorded in it. Otherwise, the first of them is recorded the name of the state, and the second - a list of some internal actions or transitions in this state. At the same time, an action in the UML language is understood as a certain atomic operation, the execution of which leads to a state change or the return of some value (for example, “true” or “false”).
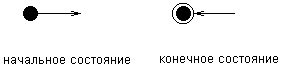
Initial and final state:
The initial state is a special case of a state that does not contain any internal actions. In this state, the default object is at the initial moment of time. It serves to indicate on the state diagram of the graphic area, from which the process of changing states begins. Graphically, the initial state in the UML language is denoted as a filled circle, from which only the arrow corresponding to the transition can go.
The final (final) state is a special case of the state, which also does not contain any internal actions. In this state, there will be a default object after the automaton has finished working at the final moment of time. It serves to indicate on the state diagram of the graphic area in which the process of changing states or the life cycle of a given object is completed. Graphically, the final state in the UML language is denoted as a filled circle placed in a circle, which can only include the arrow corresponding to the transition.
Transition
Transition (transition) is a relationship between two successive states, which indicates the fact that one state changes to another. The stay of the simulated object in the first state can be accompanied by the execution of some actions, and the transition to the second state will be possible after the completion of these actions, as well as after the satisfaction of some additional conditions. In this case, the transition is said to work. Before the transition is triggered, the object is in its previous state, called the initial state, or in the source (not to be confused with the initial state - these are different concepts), and after its triggering, the object is in the next state (target state). The transition is indicated by an arrow.
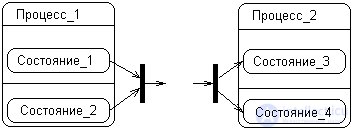
Transitions between parallel states
In some cases, the transition may have several source states and several target states. Such a transition received a special name - a parallel transition. The introduction of a parallel transition into consideration is due to the need to synchronize and / or separate individual subprocesses into parallel threads without specifying additional synchronization in parallel sub-switches.
Graphically, such a transition is represented by a vertical dash. If a parallel transition has two or more incoming arcs, then it is called a join. If it has two or more arcs emanating from it, then it is called a fork. The text string of the parallel transition specification is written next to the dash and applies to all incoming (outgoing) arcs.
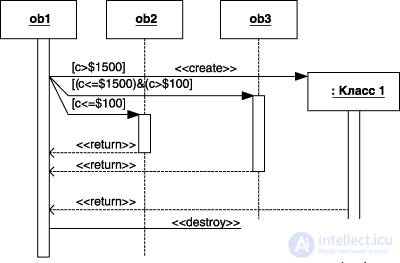
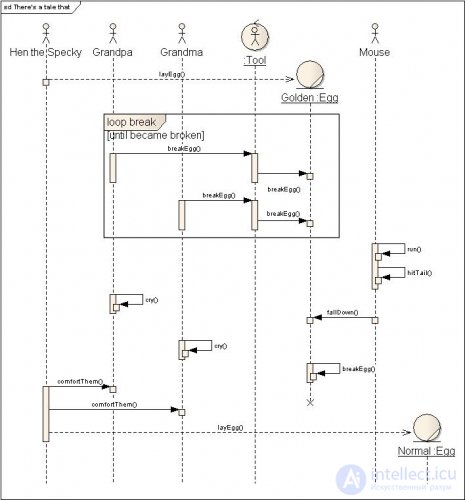
Sequence diagram
The sequence diagram is used to determine the exact logic of the use case scenario. Sequence diagrams display the types of objects that interact when executing use cases, the messages they send to each other, and any return values associated with these messages. The rectangles on the vertical lines show the "lifetime" of the object. Lines with arrows and method name labels mean a method call on an object. Control information can be added to the diagrams: a description of the conditions under which the message is sent; flag of multiple posting (iteration marker); sign of the return message.
The sequence diagram shows only those objects that are directly involved in the interaction and do not show possible static associations with other objects. For the sequence diagram, the key point is precisely the dynamics of the interaction of objects in time. At the same time, the sequence diagram has two dimensions. One - from left to right in the form of vertical lines, each of which depicts the life line of an individual object participating in the interaction. Graphically, each object is depicted as a rectangle and is located at the top of its line of life. Inside the rectangle, the name of the object and the name of the class are written, separated by a colon. In this case, the entire entry is emphasized, which is a sign of an object, which, as is known, is an instance of a class.
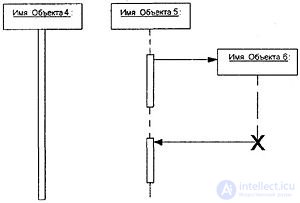
Object life line
The lifeline of an object is represented by a dotted vertical line associated with a single object in the sequence diagram. The lifeline is used to indicate the period of time during which an object exists in the system and, therefore, can potentially participate in all its interactions. If an object exists in the system permanently, then its life line must continue along the entire plane of the sequence diagram from its highest to the lowest part.
Individual objects, having fulfilled their role in the system, can be destroyed in order to free the resources they occupy. For such objects, the line of life ends at the moment of its destruction. It is not necessary to create all objects at the initial moment of time. Individual objects in the system can be created as needed.
Messages
Each interaction is described by a set of messages that the objects participating in it exchange with each other. In this sense, the message (message) is a complete piece of information that is sent from one object to another. In this case, the reception of a message initiates the execution of certain actions aimed at solving a particular task by the object to which this message was sent.
Thus, the messages not only transmit some information, but also require or imply the execution of the expected actions from the receiving object. Messages can initiate operations by an object of the corresponding class, and the parameters of these operations are transmitted along with the message. In the sequence diagram, all messages are ordered by the time of their occurrence in the simulated system.
In such a context, each message has a direction from the object that initiates and sends the message to the object that receives it. In this case, the message from the client has the form of requesting a certain service, and the server’s response to the request after receiving the message can be associated with performing certain actions or sending the necessary information to the client, also in the form of a message. Usually messages are depicted by horizontal arrows connecting the lifelines.
Types of messages:
UML provides some standard actions that are performed in response to receiving the corresponding message. The following basic message types are used to model actions:

Another kind of messages is asynchronous messages. They do not wait for a response, do not suspend the flow of execution - immediately after they are sent, an immediate transition to the next step takes place, and the sequence continues.
Time constraints in sequence diagrams
In some cases, the implementation of certain actions on the sequence diagram may require an explicit specification of the time constraints imposed on the interval of operations or the transfer of messages. In UML, curly braces, {d..t}, are used to record time constraints. Time constraints can relate to the execution of certain actions by objects, as well as to the messages themselves.
Object diagram
An object diagram contains many instances of entities represented in a class diagram. Thus, object diagrams express the static component of the interaction and consist of cooperating objects, but the messages are not shown. The object diagram reflects the state of the system at a fixed point in time.
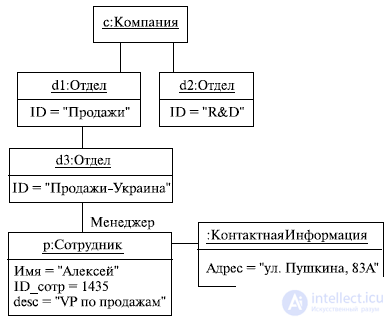
An object diagram is characterized by the following properties:
The basic elements of an object diagram, as well as class diagrams — the class and interface are described above. Main relationships in the object diagram:
ArgoUML is open source software (OpenSource) and is distributed under the BSD license.
ArgoUML is written entirely in Java and is suitable for any operating system with installed Java 2 JRE or JDK version 1.4 or higher. ArgoUML functionality includes:
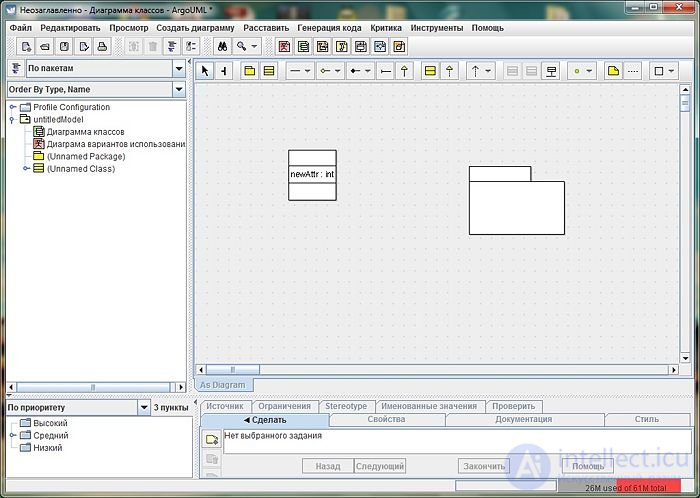
Allows you to work with the following diagrams:
The UModel software product developed by Altova is a UML editor with a closed engineering function. It supports UML 2.3 and implements code generation and reverse reengineering for the C #, VB.NET and Java programming languages. Additionally, UModel implements diagrams for working with XML schemas and BPMN notation and implements plug-ins for Microsoft Visual Studio and Eclips.
AltovaUModel supports all UML 2.3 specification diagrams.
Interface Description
The UModel interface contains several auxiliary panels. The Model Tree panel displays the hierarchy of the elements of the current UML model. The panel allows you to manipulate elements — delete, modify elements, sort them according to specified criteria, etc. The Diagram Tree panel displays the full list of UML diagrams used in the project. Charts can be displayed as a general list or as a tree when diagrams are grouped by type. The Favorites panel allows you to keep a list of frequently used UML elements — classes, objects, associations, etc. — and have quick access to them. The Properties and Styles panels display the list of properties and styles of the selected UML element, and the Hierarchy panel displays all the links of the selected element in graphic form or in the form of a tree. The Overview pane displays a general diagram of the current diagram. The Documentation panel allows you to document the selected UML element. Finally, the Layers panel allows you to control the placement of chart elements on different layers - just like it is done in graphic editors - to create, delete layers, block them from changes, etc. There is another auxiliary Messages panel that displays messages errors, warnings and hints that the program generates in the process of engineering, checking the syntax of the project, etc. 
Elements are added to charts using the toolbar or via the context menu.
Code generation and reverse engineering
UModel implements the functions of closed engineering - allows you to generate code based on UML diagrams, create UML diagrams based on existing code and perform automatic synchronization of code and model. Code generation for Java 1.4, Java 5.0, Java 6.0, C # 1.2, C # 2.0, C # 3.0, VB 7.1, VB8.0 and VB 9.0 is supported. Maintained at a good level - there is even the ability to use generic types (generics). In order to create a new class in UModel and generate a working code for it, all you need to do is just a few steps. First of all, we create a new project and attach a UML profile to the project, which describes the syntax of the required programming language. Next, add a new class to the UML model and specify its properties and methods. After that we create a new component and select a working directory for it - files will be saved to it, generated for classes of this component. We connect a class and a component, indicating that the class should be implemented in this component. As a result, we give someone *** to do a syntax check in the project. The UModel checks the syntax, reports all potential problems (for example, the type of data returned by the method is not specified) and generates code.
The code is generated based on the code generation patterns specified in separate files. Templates can be edited - take into account the necessary naming conventions, add support for using third-party libraries, etc. Templates are implemented in the Spy programming language (SPL) language.
Two modes of reverse reengineering are supported - creating a new project or updating the current project. The ability to update the current UML model makes it possible to implement the function of closed engineering when the UML model and code are automatically synchronized.
The original UML model can be used not only for generating source codes, but also for generating documentation. UModel allows you to generate documentation in Word, RTF and HTML.
Additional diagrams: XML schemas and BPMN
In addition to standard UML diagrams, UModel implements two additional diagrams — diagrams for XML schemas and BPMN diagrams (Business Process Modeling Notation).
Working with XML Schemas in Altova UModel
The UModel program is capable of displaying XML schemas in a format completely similar to UML class models. In fact, UModel considers XML schemas as another kind of "programming language" - for XML schemas, code generation and reverse engineering are also supported.
BPMN chart support
BPMN diagrams are OMG standard and are actively used in business process modeling by business analysts, technical developers, business managers, etc. UModel not only fully realizes the capabilities of BPMN diagrams, but also complements their useful capabilities. For example, support for layers makes it possible to place comments in BPMN diagrams on a separate layer, which is extremely convenient in practice.
Xmi
UModel provides full support for importing and exporting data in XMI version 2.1. This support makes it possible to exchange data between UModel and other UML-tools developed, in particular, by third-party developers. For convenience, UModel implements backward compatibility with UML 2.1 and UML 2.0 - in case you need to open the created diagrams in a UML editor that does not support UML 2.3. XMI support allows you to create "standard" archival copies of UModel projects that can be opened with the help of any modern UML editors.
MagicDraw is a professional program designed for visual UML modeling, as well as a CASE tool with collaboration support and collaboration support. UML is a general-purpose visual modeling language that is designed for the specification, visualization, design, and documentation of software components, business processes, and other systems. MagicDraw UML is at the same time a simple and powerful modeling tool that can be effectively used to build conceptual, logical and graphical models of complex systems of the most diverse purpose. Designed for business analysts, programmers and engineers.
MagicDraw, like UModel, implements functions of closed engineering - it allows you to generate code based on UML diagrams, create UML diagrams based on the existing code. Code generation is supported for languages such as Java, EJB, C #, C ++, CORBA IDL, DDL, WSDL, XML. Teamwork Server - designed to work as a group of developers with a single model. Supports integration with the following software:
MagicDraw works with most operating systems such as Windows 98 / Me / NT / 2000 / XP / Vista, Solaris, OS / 2, Linux, HP-UX, AIX, MacOS (X), like any other that support Java 5 or 6
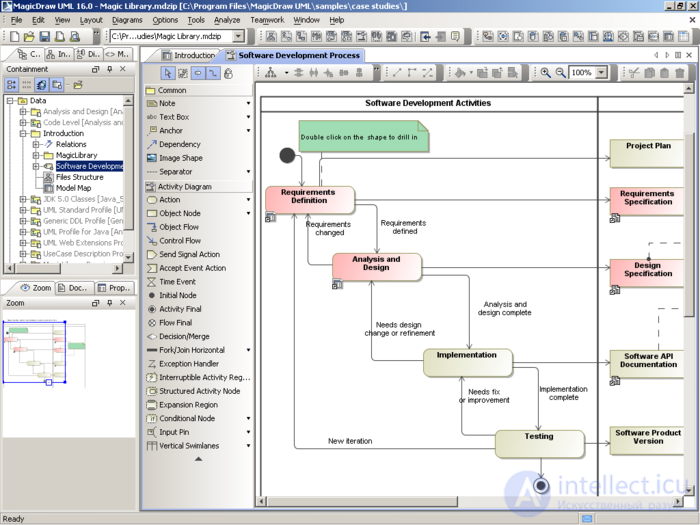
MagicDraw allows you to work with the following diagrams:
The Enterprise Architect program is developed by Sparx Systems. Currently available version of Enterprise Architect 7.5. The program has a relatively low price compared to other requirements management systems. According to SparxSystems, almost 200,000 registered users around the world work with this program.
Enterprise Architect (EA) – CASE-инструмент для проектирования и конструирования программного обеспечения. EA поддерживает спецификацию UML2.0+, описывающую визуальный язык, которым могут быть определены модели проекта. Некоторые из ключевых функций ЕА:
Using EA, you can perform forward and reverse engineering of ActionScript, C ++, C #, Delphi, Java, Python, PHP, VB.NET and Visual Basic classes, synchronize code and model elements, design and generate database elements. Documentation in standard rtf format can be quickly created from models and imported into Word for final editing, as well as generating HTML documents. EA supports all UML 2.0 models / diagrams. It can be used to model business processes, web sites, user interfaces, networks, hardware configurations, messages, etc., estimate the amount of work involved in project work in hours, record and trace requirements, resources, test plans, defects and change requests. So EA is a modern tool that supports all aspects of the development cycle, providing complete tracing from the start of design to placement and support. It also provides support for testing, tracking and change management.
Creating a new project and the appearance of the system
When creating a new project, the program suggests choosing one of the pre-installed project models. The following models are available: Bussiness Process, Requirements, Use Case, Domain Model, Class, Database, Component, Deployment, Testing, Maintenance, Project Management, User Interface.
The program workspace when working with diagrams is divided into four main parts by default (we do not take into account the toolbar, the status bar and the menu bar): Project Browser Model View, Resourses, Notes, Toolbox and, in fact, the Diagram panel.
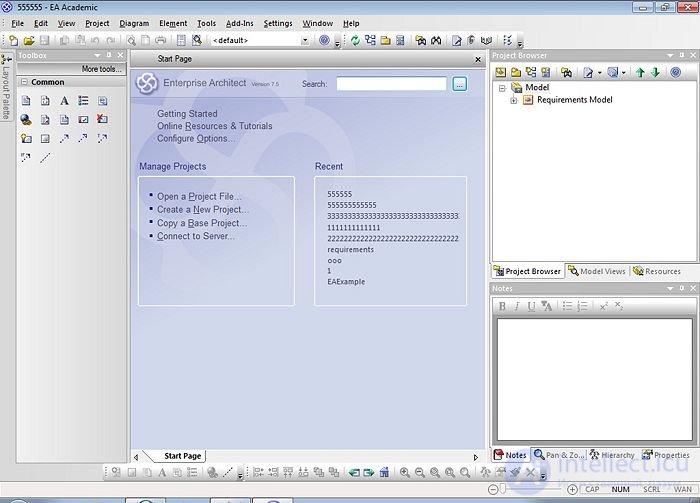
We briefly describe the purpose of each panel:
Microsoft Visio is a chart and flowchart editor for Windows. Uses vector graphics to create charts.
Available in two editions: Standard and Professional. Visio was originally developed and manufactured by Visio Corporation. Microsoft acquired the company in 2000, when the product was called Visio 2000.
Using Microsoft Visio, it is possible to visually document, develop and evaluate the state of business processes and systems using a wide range of available diagrams, including business process flowcharts, network diagrams, workflow diagrams, database models and software diagrams. To make the diagrams even more useful and visual, it is possible to link them in Microsoft Visio Professional 2007 with the original data.
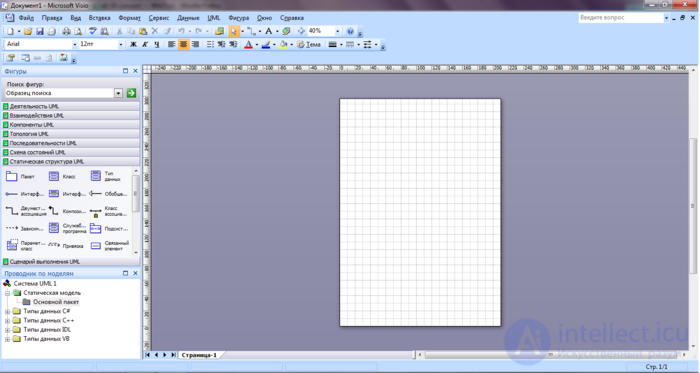
This package of the Microsoft Office family is intended solely for drawing diagrams. Visio has some additional features, but at the most it is only a tool for illustrating MS Office documents, which is not reaching the level of the packages described earlier.
Visio's visual capabilities are really quite wide, besides the program supports:
Visio is not a complete modeling tool, but an illustration creation program (like SmartDraw and Dia), which can, among other things, draw UML diagrams.
The term “pattern” received worldwide fame after the publication of the book Object-Oriented Design Techniques. Design patterns. The authors of the book, E. Gamma, R. Helm, R. Johnson, J. Vlissides, are better known as the “Gang of Four” (Gang of Four, often shortened to GoF). In this book, only 23 templates were described, but it gave impetus to the emergence of new works on this topic.
We can say that patterns are standard solutions for typical problems arising in object-oriented design, a certain set of ready-made solutions that are suitable for most tasks.
Experienced object-oriented developers have formulated general principles and standard solutions that help in software development. If these principles and idioms are systematized and structured, as well as their names are assigned, then they can be used as patterns / patterns.
For example, Information Expert Pattern
In an object-oriented design technology, a pattern is a named description of a problem and its solutions that can be applied in the design of other systems. Ideally, the pattern should contain tips on its use in various situations, as well as a description of its advantages and disadvantages. Many patterns contain recommendations on the distribution of responsibilities between objects, taking into account the specifics of the task.
Simply put, a pattern is a “problem-solution” named pair containing recommendations for use in various specific situations that can be used in different contexts.
From the above definition, we can conclude that the pattern should have a name. Patterns have meaningful names, such as Information Expert or Factory. Pattern naming has the following advantages:
Generating patterns
This group contains patterns that describe different ways of creating objects. First of all, this is the “Factory Method” (Factory Method), the reception of the definition of the interface for creating objects, and the selected class is embodied in the subclasses. The Abstract Factory template defines the interface for creating families that are interconnected or independent objects whose specific classes are unknown. Using the Builder template, you can separate the process of constructing a complex object from its concrete representation and use the same process to create different representations. A “prototype” (Prototype) describes the types of objects being developed using a prototype and creates new ones by copying it. Using the “Singleton” template ensures that
Structural Patterns
In this group, collected patterns that allow you to change the structure of the interaction of classes. The “Adapter” (Adapter) allows you to adapt the class interface to a specific situation; using the “Bridge” template, you can separate the class interface and its implementation; the “Composite” combines objects into a tree structure to represent the hierarchy from the particular to the whole. Linker allows clients to consistently access individual objects and groups of objects. The Designer pattern (Decorator, also known as the Wrapper, “Shell”) allows you to dynamically add a new behavior to an object; Facade - hide the complexity of the system by reducing all possible external calls to a single object delegating to their respective system objects.
Behavior patterns
In this group, templates are collected that are responsible for implementing the behavior of objects. “Chain of Response” allows you to skip a request through a chain of objects, “Kom *** a” (Command) encapsulates *** in the object, “Interpreter” allows you to create a common declarative solution for frequently changing conditions. tasks. In the Iterator template (Iterator), sequential access to the collection is organized, Mediator defines a simplified class interaction mechanism, Memento defines principles that allow you to record and restore the internal state of an object. Using the “Observer” template, you can notify about changes in the set of objects, “State” - change the behavior of an object when its state changes. The “Strategy” encapsulates an algorithm within a class.
The Pattern Method pattern outlines specific steps in the algorithm and relies on subclasses to implement them. Using the "Visitor" pattern, new operations are added to the class without changing it.
Examples of design patterns can be found here.
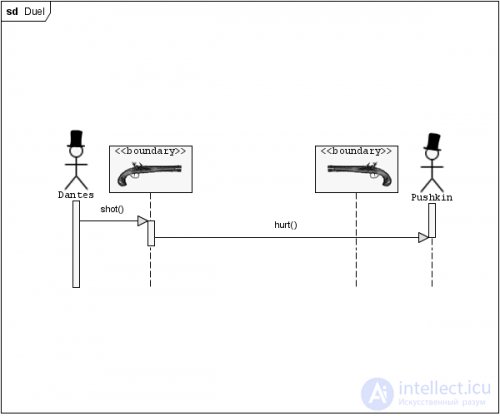
Examples of diagrams that were considered at the laboratory:


Comments
To leave a comment
Object oriented programming
Terms: Object oriented programming