Lecture
story
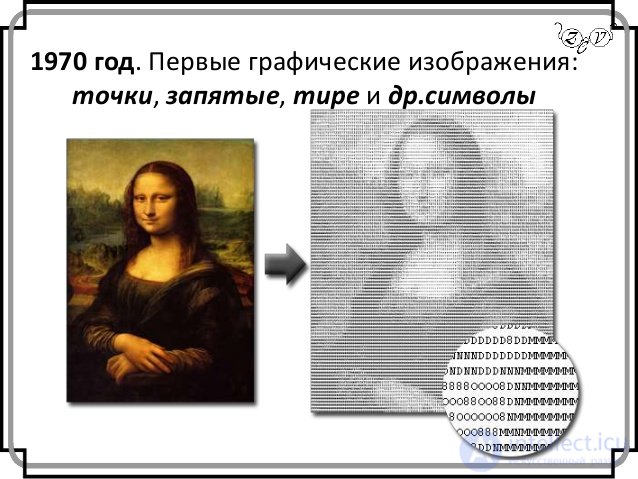
Raster graphics
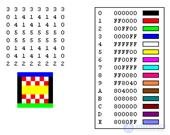
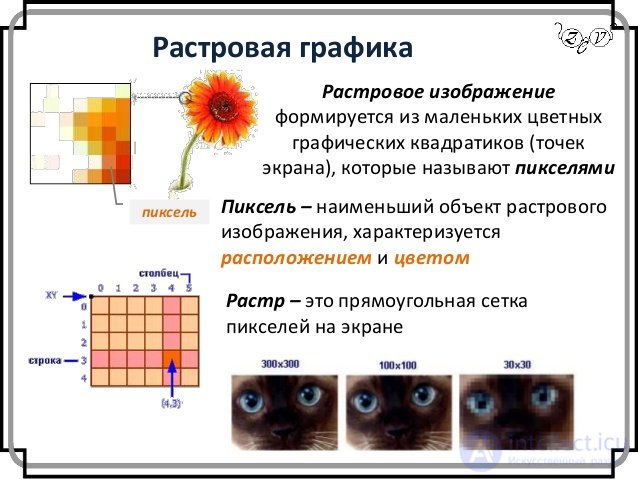
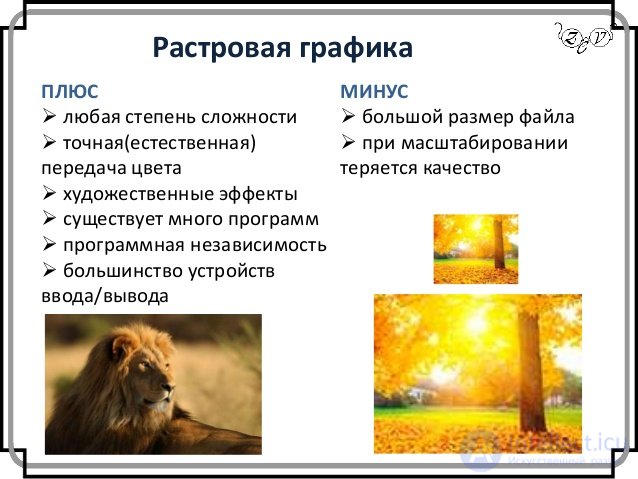
The main (smallest) element of the bitmap is a point. If the image is screen, then this point is called a pixel. Each pixel of a bitmap image has properties: placement and color. The greater the number of pixels and the smaller their size, the better the image looks. Large amounts of data are a major problem when using bitmaps. For active work with large-size illustrations such as a journal strip, computers with extremely large RAM sizes (128 MB or more) are required. Of course, such computers must have high-performance processors. The second disadvantage of raster images is connected with the impossibility of their increase for consideration of details. Since the image consists of points, the increase in the image only leads to the fact that these points become larger and resemble a mosaic. No additional details can be considered when enlarging the bitmap. Moreover, increasing the points of the raster visually distorts the illustration and makes it coarse. This effect is called pixelation.

Vector graphics
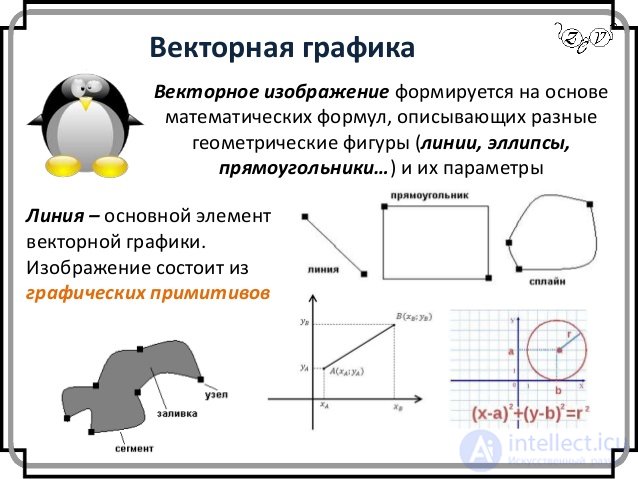
As in raster graphics the main element of the image is a point, so in vector graphics the main element of the image is a line (it does not matter if the line is a line or a curve). Of course, in the raster graphics there are also lines, but there they are considered as a combination of points. For each point of the line in the raster graphics, one or several memory cells are allocated (the more colors there are dots, the more cells they are allocated). Accordingly, the longer the raster line, the more memory it takes. In vector graphics, the amount of memory occupied by a line does not depend on the size of the line, since the line is represented as a formula, or more precisely, as several parameters. Whatever we do with this line, only its parameters that are stored in memory cells change. The number of cells remains unchanged for any line.
A line is an elementary vector graphics object. All that is in the vector illustration consists of lines. The simplest objects are combined into more complex ones, for example, the object quadrilateral can be considered as four connected lines, and the cube object is even more complicated: it can be considered either as twelve connected lines or as six connected quadrilaterals. Because of this approach, vector graphics are often called object-oriented graphics. We said that vector graphics objects are stored in memory as a set of parameters, but we should not forget that all images are still displayed on the screen as points (simply because the screen is so arranged). Before displaying each object, the program calculates the coordinates of the screen points in the object image, therefore vector graphics are sometimes called computed graphics. Similar calculations are made when objects are printed to the printer. Like all objects, lines have properties. These properties include: line shape, its thickness, color, character of the line (solid, dotted, etc.). Closed lines have the property of filling. The internal area of a closed contour can be filled with color, texture, map. The simplest line, if it is not closed, has two vertices, which are called nodes. Nodes also have properties on which it depends on how the vertex of the line looks and how the two lines mate with each other.
In vector graphics, an image consists of simple elements called primitives: lines, circles, rectangles, shaded areas. Borders of areas are set by curves.
The file displaying the vector image contains the initial coordinates and parameters of the primitives - vector commands.
In vector graphics, images are created by combining various objects (Figure 3.14).

Figure 3.14. Vector graphics:
A - graphic primitives; B - vector image
The shape, color and spatial position of objects that make up vector graphics are always described using a combination of computer commands and mathematical formulas. This allows computing devices to calculate and place real points in the right place when drawing these objects. Vector graphics are often called object-oriented [35].
Objects of vector graphics are stored in the computer's memory as a set of parameters, and on the monitor screen the image looks like a set of points. Before displaying each object, the program calculates the coordinates of the screen points in the object image, therefore vector graphics are also called computed graphics.
CAD programs work with vector graphics. At first glance, this may seem more complicated than using raster arrays, but for some types of images, the use of mathematical descriptions is a simpler way [25]. In vector graphics, objects are created by combining various objects. To create primitive objects, simple descriptions are used. Straight lines, arcs, circles, ellipses, and areas of monochromatic or changing light are two-dimensional patterns used to create detailed images. In three-dimensional computer graphics, such elements as spheres, cubes can be used to create complex patterns.
Advantages of vector graphics description
• A vector image that does not contain raster objects occupies a relatively small place in the computer's memory. This is due to the fact that not the image itself is saved, but only some basic data, using which the program recreates the image every time. In addition, the description of color characteristics almost does not increase the file size. When resizing an image, the file size does not change. Since the formulas describing the image remain the same, only the proportionality coefficient changes. On the other hand, this method of storing information has its drawbacks. For example, if you make a very complex geometric shape (especially if there are a lot of them), then the size of the “vector” file may be much larger than its “raster” analogue due to the complexity of the formulas describing such an image.
• One of the greatest strengths of vector graphics is that the parameters of objects are stored and can be changed. This means that moving, scaling, rotating, filling, etc. will not degrade the quality of the pattern. When editing elements of vector graphics change the parameters of straight and curved lines describing the shape of these elements. Thus, increasing or decreasing objects is done by increasing or decreasing the corresponding coefficients in mathematical formulas with almost no change in the size of the source file. Scaling, rotation, curvature can be reduced to a pair-three elementary transformations over the vectors. The big plus is the huge image accuracy regardless of scale. You can transfer elements, change their size, shape and color, but this will not affect the quality of their visual presentation.
• Huge accuracy of the vector image (up to a hundredth of a micron).
• Vector graphics give excellent print quality. It does not depend on the resolution, i.e. it can be shown in various output devices with different resolutions without loss of quality. This allows you to resize a vector pattern without losing its quality. Vector commands simply tell the output device that it is necessary to draw an object of a given size using as many points as possible. In other words, the more points the output device can use to create an object, the better it will look. The contours of vector objects, created directly with the help of points printed by the printer, are located relative to each other in such a way as to create the fullest possible illusion of smooth borders, which the raster objects do not have.
• No problems with the export of a vector image in a raster. Usually indicate the dimensions in the device-independent units (English device-independent unit), which lead to the best possible rasterization on raster devices.
• Advanced tools for integrating images and text, a unified approach to them. Therefore, vector graphics programs are indispensable in the field of design, technical drawing, for drawing and graphic and design works.
• Objects in a vector image are arranged in layers and can overlap without any influence on each other. Thus, you can edit any of the objects in the picture, without affecting the rest.
Disadvantages of vector graphics
• Nature avoids straight lines, and they are the main components of vector designs. Until recently, this meant that the lot of vector graphics was images that never tried to look natural, for example, two-dimensional drawings and pie charts created by special CAD programs, two-and three-dimensional technical illustrations, stylized drawings and icons consisting of straight lines and areas filled with a monochromatic color.
• Not every object can be easily depicted in vector form. In addition, the amount of memory and time to display depends on the number of objects and their complexity.
• Translation of vector graphics into raster is quite simple. But it is almost impossible to export from raster format to vector (you can trace the image, although getting a good vector image is not easy when the graphics are black and white, and almost impossible if the image is color), thus raster tracing usually does not provide high quality vector graphics.
• It is impossible to use an extensive library of effects used when working with raster images.
• Vector drawings consist of various commands sent from a computer to output devices (printer). Printers contain their own microprocessors, which interpret these commands and try to translate them into points on a sheet of paper. Sometimes, due to communication problems between two processors, the printer cannot print out the individual details of the drawings.
• Vector graphics become unprofitable when transferring photo-realistic images with a large number of shades or small details (for example, photographs, aerial photographs and satellite images). After all, any smallest flare in this case will be represented not by a set of monochrome dots, but by a complex mathematical formula or a set of graphic primitives, each of which is a formula. This will lead to a large increase in file size.
• For vector graphics, software dependency is peculiar: each program saves data in its own format, so an image created in one vector program is usually not converted to another program format without errors. In addition, the vector principle of image description does not allow to automate the input of graphic information, as the scanner for raster graphics does.
• There is a very narrow class of devices focused exclusively on the display of vector data. These include vector-scanned monitors, plotters, and some types of laser projectors. Modern computer video displays display information in raster format. To display a vector format on a raster, converters are used, either software or hardware, built into the video card. For ease of processing, vector graphics objects are not converted to a raster form until the last moment - until all dimensions and resolution of the printer have been determined. For example, PostScript printers have a hardware rasterizer (RIP - Raster Image Proceccor), which converts vector data in PostScript into raster form.
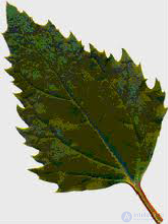
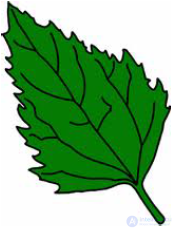
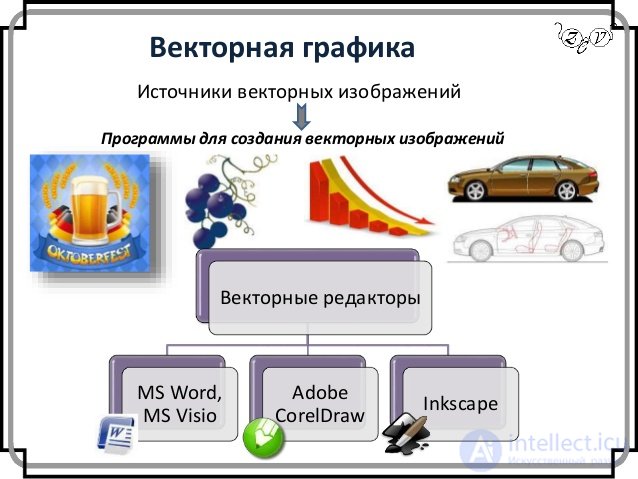
Software for working with vector graphics are designed to create illustrations and to a lesser extent for their processing. Design works based on the use of fonts and simplest geometric elements are much easier to solve using vector graphics (Fig. 3.15).
Figure 3.15. Vector illustration
In most vector graphics formats, it is possible to embed text (with Unicode support), which can then also be an element of vector graphics in the image, but can often be re-imported from there. You can also insert raster images into vector graphics - when scaled, their size will change in proportion to the rest of the elements (like a rectangle), but with all the ensuing consequences for this type.
Vector images are widely used in advertising agencies, design and design bureaus. Traditionally, vector graphics are used to create fonts, logos, as well as for layout printing products (business cards, booklets, magazines, etc.). It is also convenient for use in office applications - in the construction of diagrams, diagrams, drawings and simple drawings.
The programs of 3-dimensional modeling, which also have a vector nature, are becoming increasingly common [28]. Possessing certain methods of rendering (ray tracing method, radiance method), these programs allow you to create photorealistic raster images with arbitrary resolution from vector objects with moderate time and effort. There are examples of highly artistic works created by means of vector graphics, but they are more the exception than the rule, since the artistic preparation of illustrations by means of vector graphics is extremely complex.
Vector graphics are the best means for storing high-precision graphics (drawings, diagrams, etc.), for which the preservation of clear and clear contours is important (Fig. 3.16). Vector graphics are widely used when working with computer-aided drawing and computer-aided design (CAD) systems, as well as processing programs of three-dimensional graphics.
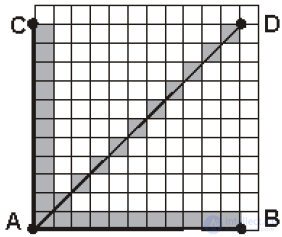
Figure 3.16. Display of straight line segments (AD, AC, AB) in vector and raster graphics
To view or edit vector images, special programs are required. The most popular editors at the moment are Adobe Illustrator and CorelDRAW, FreeHand, etc.
There is a tendency to convergence of vector and raster graphics. Thus, most modern vector editors are able to use raster images as a background, as well as transfer parts of an image into a vector format using built-in tools. And usually there are tools for editing the loaded background image at least at the level of various built-in or installed filters.
Working with graphics involves the use of both vector and raster forms. For the qualitative performance of the necessary graphic tasks, it is necessary to know the strengths and weaknesses of both its forms. Comparative characteristics of raster and vector forms are presented in Table. one.
Table 1 - Comparison of raster and vector graphics
| Raster graphics | Vector graphics |
 |  |
| The base element of the image is a pixel. | The basic element of the image is the line |
| The image is stored as a simple table of pixels, each of which has its own color. | The image is stored as a set of lines, each of which has coordinates of the beginning and end, shape and color |
| Image quality is determined by the resolution of the original and color depth. | Image quality is determined by the clarity of the contours of objects |
| Raster graphics | Vector graphics |
| Image scaling can lead to quality degradation, since pixelization is observed when zoomed. | Image scaling occurs without loss of quality and with almost no increase in the size of the original image file. |
| The image is difficult to transform (rotation, curvature, etc.). Процедуры, которые применяются для трансформации рисунка, проходят с искажениями. | Объекты векторной графики легко трансформируются, что не оказывает практически никакого влияния на качество изображения |
| Изображение выглядит вполне реально, так как каждый пиксель передает цвет. Можно получать живописные эффекты, скажем, туман или дымку, добиваться тончайшей настройки цвета, создавать глубину, размытость, акварельность и т. п. | Векторное изображение выглядит не совсем естественно. Это хорошо подходит для искусственных объектов инженерной графики и не годится для фотореалистичных изображений с большим количеством оттенков или мелких деталей |
| Хранение изображения требует больших ресурсов памяти компьютера, так как размер растрового файла — это произведение площади изображения на разрешение и на глубину цвета (если они приведены к единой размерности) | Для хранения изображения требуется небольшой объем памяти. Размер файла не зависит от размера изображения, так как сохраняется не само изображение, а только некоторые основные данные (координаты узлов, форма, цвет и т. п.) |
| Простота и техническая реализуемость автоматизации ввода (цифрования) графической информации. Существует развитая система устройств для ввода изображений — сканеров, видеокамер, цифровых фотоаппаратов Растровая графика | Сложность векторного принципа описания изображения не позволяет автоматизировать ввод графической информации и сконструировать устройство, подобное сканеру для растровой графики Векторная графика |
| Устройства вывода, такие как мониторы, принтеры, плоттеры и прочие, для создания изображений используют наборы точек, т. е. также имеют растровый формат. Поэтому растровые изображения легко и быстро выводятся на такие устройства, так как компьютерам легко управлять устройством вывода для представления отдельных пикселов с помощью точек | Векторные изображения долго выводятся на экран и на принтер. Устройства вывода выводят изображение по точкам, поэтому программе вывода необходимо проделать специальные процедуры расчета по переводу векторного формата в растровый (растеризация изображения) |
| Качество изображения при выводе на монитор, принтер и прочие устройства зависит от соотношения разрешения оригинала изображения и разрешения печатающего устройства. Если разрешающая способность устройства вывода гораздо ниже или ниже, чем разрешение оригинала, то может наблюдаться пикселизация изображения. | Дает прекрасное качество печати. Она максимально использует возможности разрешения печатающего устройства: изображение всегда будет настолько качественным, насколько способно данное устройство. |
Форматы векторной графики
В отличие от растровых форматов, в сфере векторной графики практически отсутствуют стандартные форматы, которые могли бы использоваться различными программами и на разных платформах. Почти все векторные графические программы имеют свои собственные форматы, что связано, скорее всего, со спецификой алгоритмов формирования векторного изображения (рис. 3.17). Файлы векторных форматов содержат описания изображения в виде набора команд для построения графических примитивов, а также некоторую дополнительную информацию. Различные векторные форматы отличаются набором команд и способом их кодирования. Но так как в векторной графике иногда существует необходимость переноса файлов между различными приложениями, то своего рода стандартом стали файловые форматы WMF, CDR, AI и др. Также получили популярность некоторые универсальные форматы, поддерживающие как векторные, так и растровые изображения: EPS, PDF.
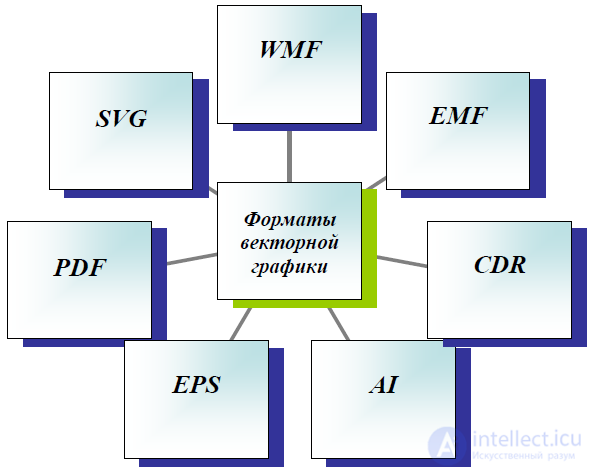
Рисунок 3.17. Форматы векторной графики

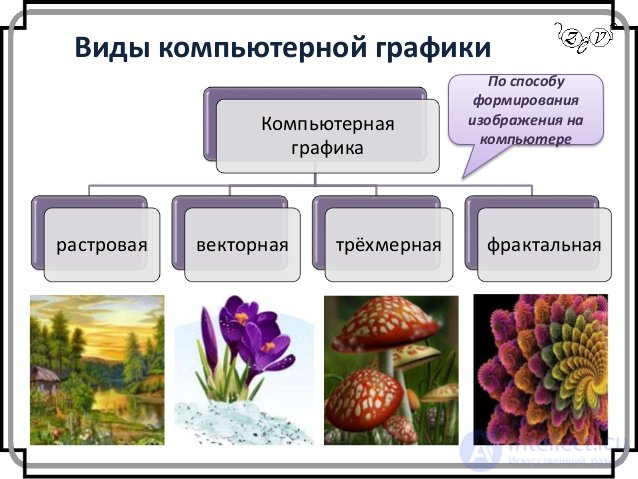
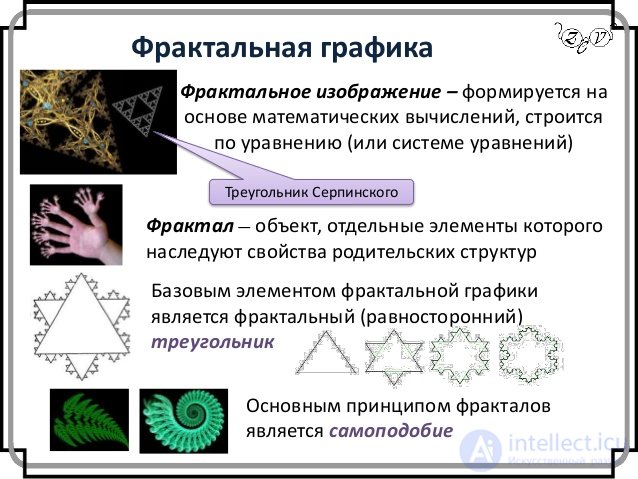
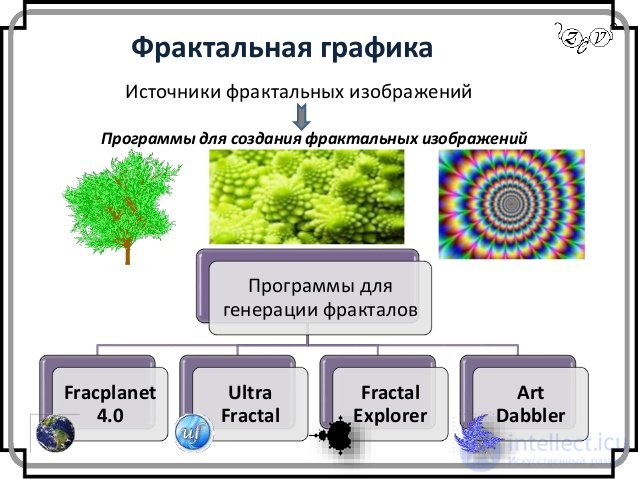
Фрактальная графика
Фрактал - это рисунок, который состоит из подобных между собой элементов. Существует большое количество графических изображений, которые являются фракталами: треугольник Серпинского, снежинка Коха, "дракон" Хартера-Хейтуея, множество Мандельброта. Построение фрактального рисунка осуществляется по какому-то алгоритму или путём автоматической генерации изображений при помощи вычислений по конкретным формулам. Изменения значений в алгоритмах или коэффициентов в формулах приводит к модификации этих изображений. Главным преимуществом фрактальной графики есть то, что в файле фрактального изображения сохраняются только алгоритмы и формулы.
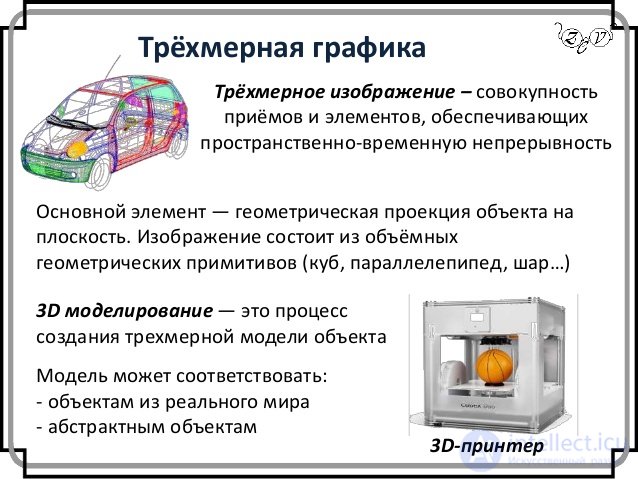
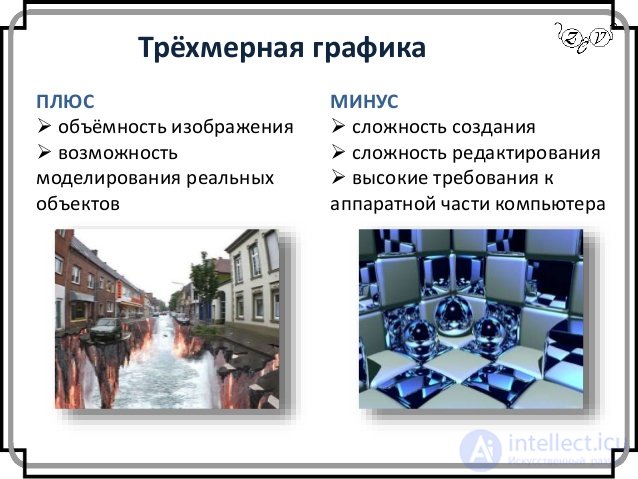
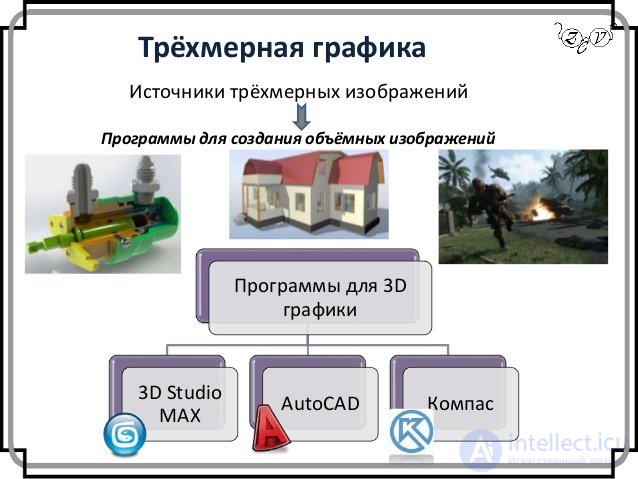
Трёхмерная графика
Трёхмерная графика (3D-графика) изучает приёмы и методы создания объёмных моделей объектов, которые максимально соответствуют реальным. Такие объёмные изображения можно вращать и рассматривать со всех сторон. Для создания объёмных изображений используют разные графические фигуры и гладкие поверхности. При помощи их сначала создаётся каркас объекта, потом его поверхность покрывают материалами, визуально похожими на реальные. После этого делают осветление, гравитацию, свойства атмосферы ии другие параметры пространства, в котором находиться объект. Для двигающихся объектом указывают траекторию движения, скорость.
Рассмотрим, к примеру, такой графический примитив, как окружность радиуса r . Для её построения необходимо и достаточно следующих исходных данных:
1. координаты центра окружности;
2. значение радиуса r ;
3. цвет заполнения (если окружность не прозрачная);
4. цвет и толщина контура (в случае наличия контура);
5. порядок плана (передний план, задний план).
Координаты центра и радиус являются обязательными параметрами, остальные данные из описания окружности часто называют атрибутами и в некоторых графических векторных редакторах опускаются. В этом случае при графическом выводе они заменяются атрибутами по умолчанию или текущими атрибутами.
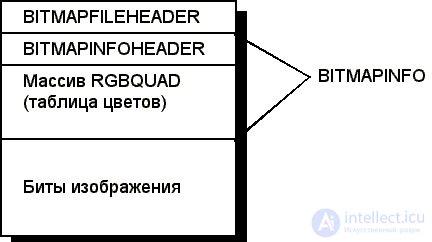
Храение растровых изображений с использованием матриц и структур на языке Си
Структура BITMAPFILEHEADER , а также указатели на нее, описаны в файле windows.h:
typedef struct tagBITMAPFILEHEADER
{
UINT bfType;
DWORD bfSize;
UINT bfReserved1;
UINT bfReserved2;
DWORD bfOffBits;
} BITMAPFILEHEADER;
typedef BITMAPFILEHEADER* PBITMAPFILEHEADER;
typedef BITMAPFILEHEADER FAR* LPBITMAPFILEHEADER;
Сразу после структуры BITMAPFILEHEADER в bmp-файле расположена структура BITMAPINFO (для изображений Windows) или BITMAPCOREINFO (для изображений Presentation Manager).
Структура BITMAPINFO и указатели на нее описаны в файле windows.h следующим образом:
typedef struct tagBITMAPINFO
{
BITMAPINFOHEADER bmiHeader;
RGBQUAD bmiColors[1];
} BITMAPINFO;
typedef BITMAPINFO* PBITMAPINFO;
typedef BITMAPINFO FAR* LPBITMAPINFO;
Структура BITMAPINFOHEADER описывает размеры и способ представления цвета в битовом изображении:
typedef struct tagBITMAPINFOHEADER
{
DWORD biSize;
LONG biWidth;
LONG biHeight;
WORD biPlanes;
WORD biBitCount;
DWORD biCompression;
DWORD biSizeImage;
LONG biXPelsPerMeter;
LONG biYPelsPerMeter;
DWORD biClrUsed;
DWORD biClrImportant;
} BITMAPINFOHEADER;
typedef BITMAPINFOHEADER* PBITMAPINFOHEADER;
typedef BITMAPINFOHEADER FAR* LPBITMAPINFOHEADER;
Сразу после структуры BITMAPINFOHEADER в фале может находиться таблица цветов. Эта таблица содержит массив структур RGBQUAD :
typedef struct tagRGBQUAD
{
BYTE rgbBlue;
BYTE rgbGreen;
BYTE rgbRed;
BYTE rgbReserved;
} RGBQUAD;
typedef RGBQUAD FAR* LPRGBQUAD ;
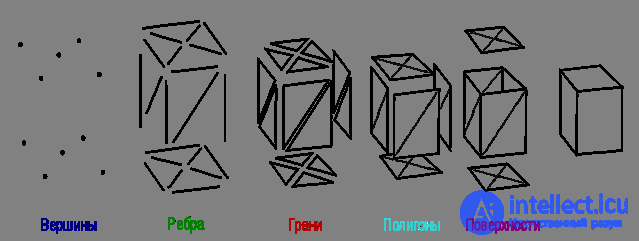
Полигональная сетка (жарг. меш от англ. polygon mesh) — это совокупность вершин, рёбер и граней, которые определяют форму многогранного объекта в трехмерной компьютерной графике и объёмном моделировании. Гранями обычно являются треугольники, четырехугольники или другие простые выпуклые многоугольники (полигоны), так как это упрощает рендеринг, но сетки могут также состоять и из наиболее общих вогнутых многоугольников, или многоугольников с дырками.
Представления изображений
Полигональные сетки могут быть представлены множеством способов, используя разные способы хранения вершин, ребер и граней. В них входят:
Список граней: описание граней происходит с помощью указателей в список вершин.
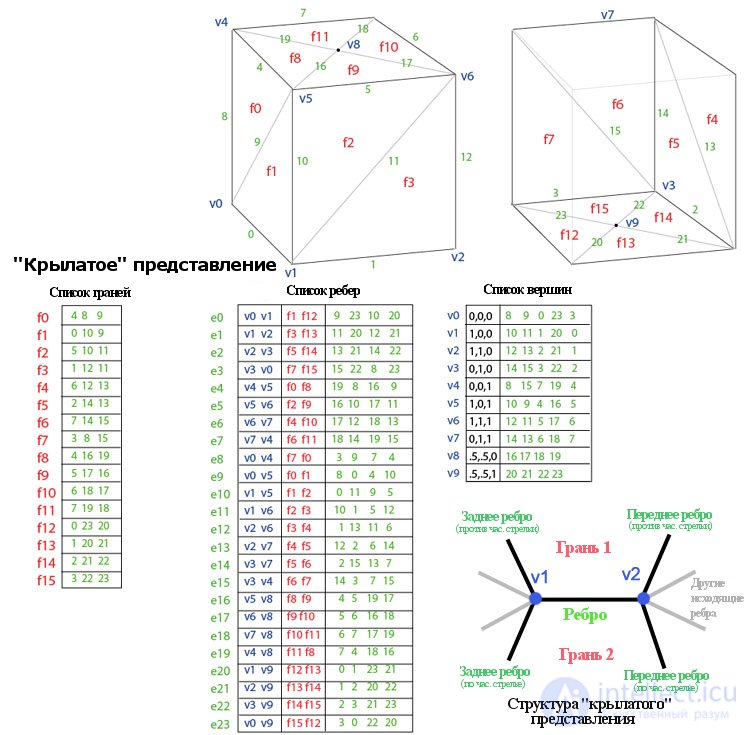
"Крылатое" представление: в нём каждая точка ребра указывает на две вершины, две грани и четыре (по часовой стрелке и против часовой) ребра, которые её касаются. Крылатое представление позволяет обойти поверхность за постоянное время, но у него бо́льшие требования по памяти хранения.
Полуреберные сетки: способ похож на "крылатое" представление, за исключением того, что используется информация обхода лишь половины грани.
Four-rib meshes [unknown term] that store edges, half-edges and vertices without any indication of polygons. Polygons are not directly expressed in the view, and can be found by traversing the structure. Memory requirements are similar to semi-edge grids.
A table of angles that store vertices in a predefined table, such that traversing a table implicitly defines polygons. In essence, this is a "fan of triangles" used in hardware rendering. The presentation is more compact and more productive for finding polygons, but operations to change them are slow. Moreover, the angle tables do not represent the grid completely. To represent most grids, you need several tables of angles (fans of triangles).
Vertex representation: only vertices pointing to other vertices are represented. Information about faces and edges is implicitly expressed in this view. However, the simplicity of the presentation allows many efficient operations on the grid.
Vertex view
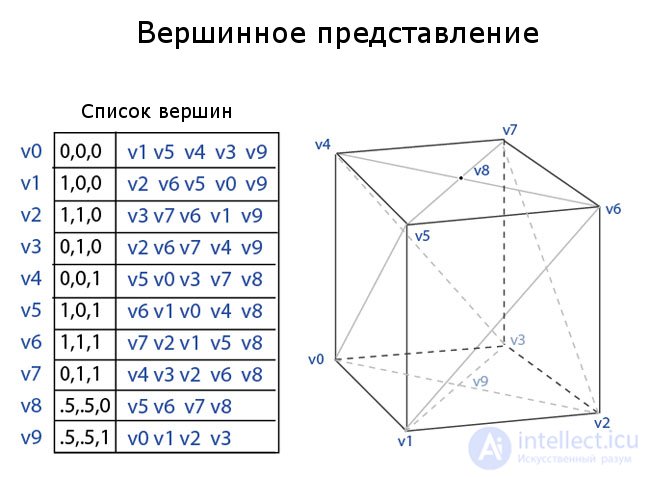
A vertex representation describes an object as a set of vertices connected to other vertices. This is the simplest representation, but it is not widely used, since information about faces and edges is not explicitly expressed. Therefore, you need to bypass all the data to generate a list of faces for rendering. In addition, it is not easy to perform operations on the edges and edges.
However, IP grids benefit from low memory usage and efficient transformation. Figure 2 shows an example of a parallelepiped depicted using a VP grid. Each vertex indexes its neighboring vertices. Notice that the last two vertices, 8 and 9 at the top and bottom of the parallelepiped, have four connected vertices, not five. The master system must deal with an arbitrary number of vertices associated with any given vertex.
Face list
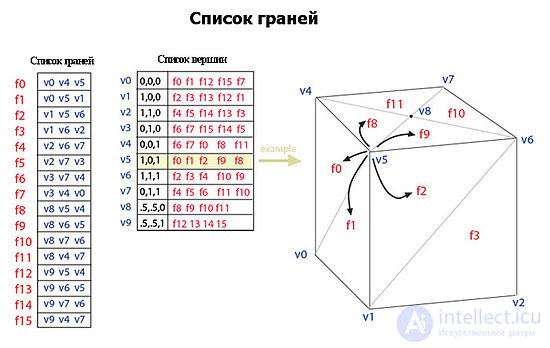
A grid using a list of faces represents an object as a set of faces and a set of vertices. This is the most widely used representation, being input data typically accepted by modern graphic equipment.
" Winged" performance
Presented by Bruce Baumgart in 1975, the “Winged” view clearly represents the vertices, edges and edges of the grid. This representation is widely used in modeling programs to provide the highest flexibility in dynamically changing the geometry of a mesh, because it can be quickly performed by breaking and joining. Their main disadvantage is high memory requirements and increased complexity due to the content of multiple indices.
The "winged" view solves the problem of going from edge to edge and provides an ordered set of faces around the edge. For any given edge, the number of outgoing edges can be arbitrary. To simplify this, the "winged" view provides only four, the nearest edges clockwise and counterclockwise at each end of the edges. Other edges can be bypassed gradually. Therefore, information about each edge resembles a butterfly, so the view is called "winged." Figure 4 shows an example of a parallelepiped in a winged view. The complete edge data consists of two vertices (end points), two faces (on each side), and four edges ("wings" edges).
Application of various data structures to describe images.
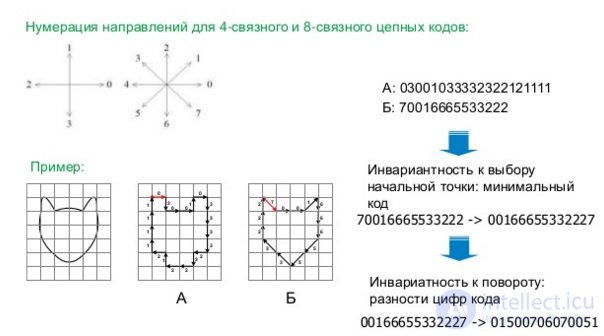
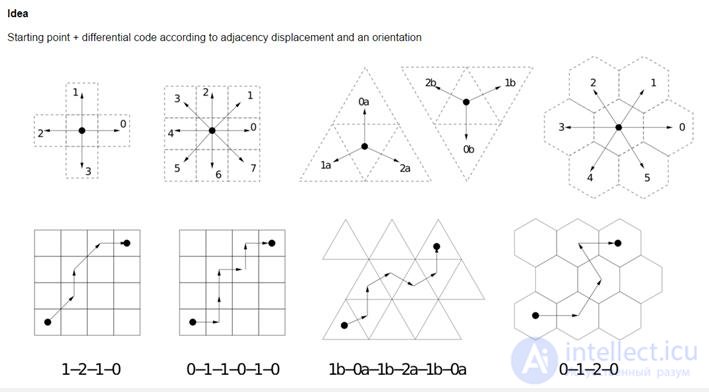
connected chain code
Chain code Freeman (Friedman) (Freeman Chain Code)
Chain codes are used to represent the border as a sequence of straight line segments of a certain length and direction. This representation is based on a 4- or 8-connected grid. The length of each segment is determined by the lattice resolution, and the directions are specified by the selected code.
(for representation of all directions in a 4-connected grid, 2 bits are sufficient, and for an 8-connected chain-grid grid 3 bits are required) 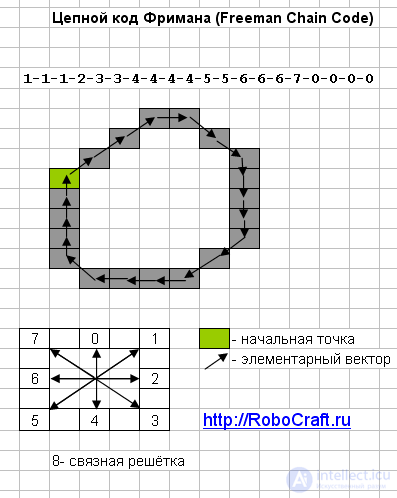
1.4. Description of the object contour In practice, the description of the selected contour is sufficiently simple when using the Freeman chain code [14]. This approach allows from two-dimensional objects to go to their one-dimensional (vector) description, i.e. chain building can also be considered as an image vectorization procedure. When performing coding with a chain code, a so-called direction matrix or a connectivity matrix of the central point of a local neighborhood of 3 x 3 size is constructed with all possible neighboring points:
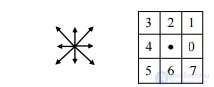
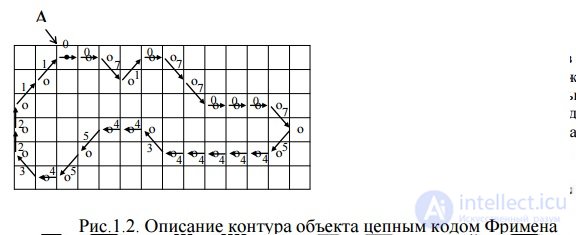
Each of the 8 possible directions of transition from the point Bij to the point Bi ± 1, j ± 1 is encoded by a three-bit code. Then the starting point is started, from which the selected contour is started to go around - let it be the leftmost upper point (Fig. 2. 3).
Then the contour can be described as: A0 (1,3) ® {0; 0; 7; 1; 0; 7; 7; 0; 0; 0; 7; 5; 4; 4; 4; 4; 4; 3 ; 4; 4; 5; 5; 4; 3; 2; 2; 1; 1}
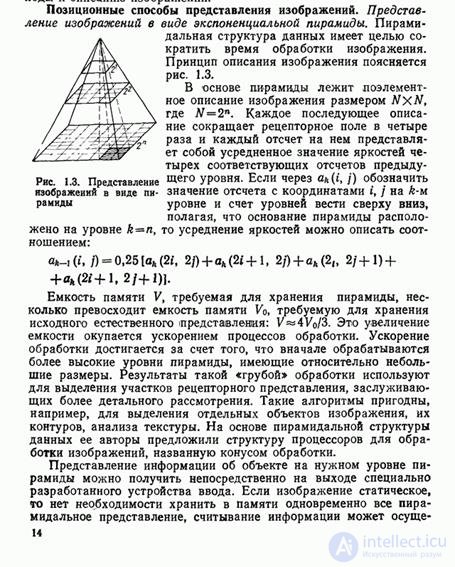
presentation of the image in the form of an exponential pyramid
Building a graph model of binary images


Comments
To leave a comment
Methods and means of computer information technology
Terms: Methods and means of computer information technology