Lecture
Pickett gave the following wording: “texture is used to describe two-dimensional arrays of brightness changes”, Prett - “texture - description of spatial ordering of image elements”, Kharalik - “texture - organized surface area”, Tamura - “texture - something constituting macroscopic region”, Richards - “The texture is defined for our purposes as an attribute of a field that has no components (components) that act as countable (enumerable)” [2-4].
It is known that the texture has a number of properties. It is thanks to these properties, we can say with confidence that the work is being done with texture. The main properties of textures can be described as:
texture is a property of the region; texture point is not defined. Those. A texture is a context property, and its definition must include the values of gray levels in a neighborhood. The size of this neighborhood depends on the type of texture.
or the size of primitives (simple geometric elements of the image) that define the texture;
the texture in the image can be perceived at different scales or
resolution levels;
A region is perceived as a texture, when the number of elementary objects (primitives) in the region is large. If only a few elementary objects are present, then a group of countable objects is perceived instead of
textured image
There are various approaches to the measurement and description of the image texture - statistical, geometric, structural
Statistical approach to the description of textures
The first works on the analysis of textures used such features as the average optical density of the image and the average spatial frequency [64].
The authors of [65] use the mean value of optical density and its dispersion as attributes for the automatic classification of aerial photographs. In work [66], the eigenvectors of the covariance matrix of the brightness of the elements of a sliding window (a rectangular image fragment) 6 × 6 elements in size are used to automatically analyze the form of clouds.
The brightness distribution of pairs of neighboring elements and a two-dimensional autocorrelation function as a description of the images of cloud fields are investigated in [67]. In later works, Rosenfeld describes the texture by the density of brightness differences, that is, the number of brightness differences per unit area [68].
To distinguish textures, Kharalik [69] uses covariance matrices characterizing second-order statistics and describing the spatial relationships of the brightness pairs of elements in a digital texture image. This approach is based on the assumption of Julesch [70] that the human eye uses statistics no higher than second order for
texture recognition. In 1978-1980, Yulesh and Gagalovich [71, 72] built, through modeling, counterexamples, however, consisting of artificial textures not found in nature. In [73]
elements of the covariance matrix B ( i, j ) are counters of the number of transitions of brightness i to brightness j for pairs of image elements spaced at a given distance d . This characteristic is not invariant to rotation, therefore it is necessary to count the number of transitions for each analyzed direction.
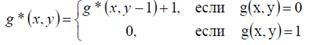
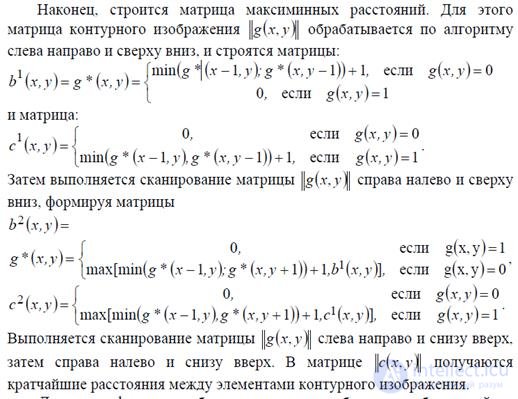
More often, it is not the calculation of the Cactax covariance matrices that is used, but rather the evaluation of the characteristics characterizing the texture based on them. In [69], Kharalik proposes to use 14 signs of textures based on statistics and information theory. In [73], on the basis of the analysis of these features, the authors proposed to use only 6 of them, representing the image estimate based on its information and statistical characteristics, such as the characteristic of homogeneity, contrast, entropy, amount of information. For texture analysis, the authors of [74–76], on the basis of the theory of statistical coding and physiology of vision, propose to use the distribution of contour segments and intervals between contour elements. These characteristics can be measured during a single TV frame using simple nonlinear filter circuits, shift registers and feedback filters. In constructing a real-time TV automaton [77], the classification of non-uniform textures was used to estimate the max-min distance between the contours.
Consider the work of this machine in more detail. When creating an automatic system for analyzing heterogeneous texture images, the following procedure is performed. Analyzed
The image is divided into fragments. For each fragment, characteristics are evaluated and histograms of their distribution are plotted. Separate informative samples of the obtained distributions are selected as attributes for recognition. The classification parameters, such as the fragment size, the number of quantization levels of the histogram of the distribution of attributes and the number of informative features, remain uncertain.
To find the parameters, the mode “stability” method is used. For some feature, the dependence of the number of histogram modes on the parameter being determined is plotted. The largest region of this parameter, in which the number of modes remains constant, is called the mode “stability” zone, and the middle of this region is used as the value of the unknown parameter. If the distribution of a trait does not have a mod or has only 1 mode, then the trait is considered uninformative and is discarded.

The number of contour elements in the fragment is calculated, a rather effective characteristic is obtained for
classification of some images The distribution of the intervals between the contours (within each row during line-by-line scanning of the image) is estimated by the formula:

For the classification, a self-learning algorithm was chosen that works by the criterion of the minimum classification error [78]. Studies have shown that such methods work effectively in analysis problems 139
images, when there are no strict requirements for the shape of the border between statistically homogeneous areas. Using the maximinum distance estimate is more effective than estimating the number of contour elements and estimating the distribution of intervals between contours. For the analysis of anisotropic textures, algorithms are proposed that take into account the dependence of the distribution of intervals between contours and contour segments along the texture scanning directions [49, 79].
The works [62, 64-81] are based on a statistical approach to the description of textures. When a statistical approach to the description of texture images are interpreted as the implementation of a random process. In [82], the concept of a type image generated by an ergodic source was introduced. Under the textures understand these types of images, class
which has the property of ergodicity, that is, any image of this texture is typical and fully characterizes all other images belonging to this class.
complement Symptoms based on statistical characteristics (adjacency matrices)
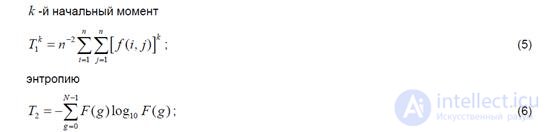
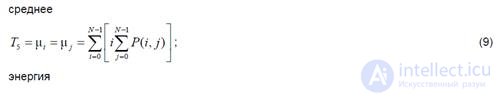
As such signs, you can use the statistical moments of spatial distributions, calculated as measures of homogeneity by a one-dimensional histogram of signal values (characteristics of the 1st order) and by two-dimensional histograms of signal values (characteristics of the 2nd order). So, the following statistical characteristics can be used as numerical estimates of the texture on a one-dimensional histogram [5]:
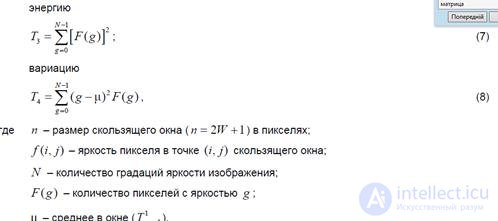
The analysis shows that texture evaluations (5) - (8), calculated from a one-dimensional frequency histogram, do not take into account the relative position of neighboring pixels in a sliding window and allow us to evaluate only group properties of pixels that are part of a landscape object in an aerospace image. Thus, these estimates are only effective for describing textures with unexpressed spatial regularity.
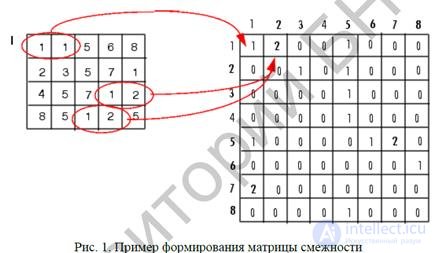
An approach based on the use of an adjacency matrix (another name is the gradient distribution matrix [4]) is given in [3-5, 7] for the formation of textural signs that take into account the mutual arrangement of pixels inside a sliding window. In the future we will use the concept of adjacency matrix
Let the analyzed image is rectangular and has x N elements horizontally and y N elements vertically. Moreover, G = {1,2, ..., N } is the set of N quantized luminance values. Then the image is described by a function of brightness values from the set G , that is: xy f L × L → G , where {1,2, ...,} xx L = N and {1,2, ...,} yy L = N - horizontal and vertical spatial areas, respectively. Set x N and y N have set
elements of resolution in the raster image. The adjacency matrix contains the relative frequencies ij p of the presence on the image of neighboring elements located at a distance d from each other, with luminances i , j ∈ G. Usually, horizontal (α = 0o), vertical (α = 90o) and transverse-diagonal (α = 45o and α = 135o) pairs of elements are distinguished. It should be noted that these matrices are symmetric, namely P ( i , j , d , α) = P ( j , i , d , α).
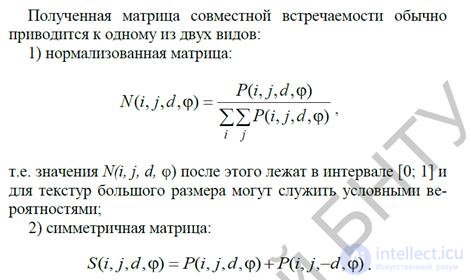
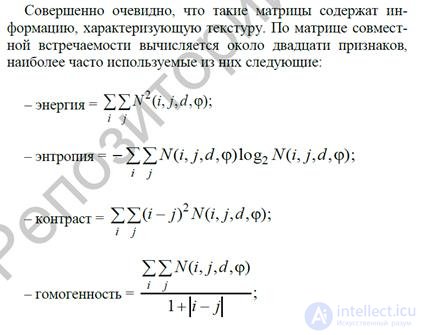
Based on the calculated adjacency matrices, it is possible to calculate directly numerical estimates of a number of textural features [5]:
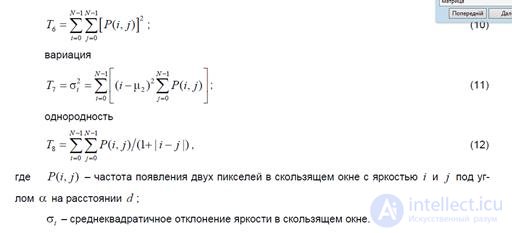
Statistical moments (9) - (12) make it possible to form textural features that take into account the relative position of neighboring pixels in a sliding window, and, accordingly, are effective for describing textures with pronounced spatial regularity
texture concept - optional

construction of adjacency matrices


Comments
To leave a comment
Methods and means of computer information technology
Terms: Methods and means of computer information technology