Lecture
There are quite a few statistical methods for solving taxonomy problems. We, due to the limited time allocated to the pattern recognition (classification) course, will dwell only on one thing, without detracting from the value or effectiveness of other methods. It is directly related to the approximation method of recognition. Indeed, the restoration of an unknown distribution in a sample in the form of a mixture of basic distributions is, in essence, a solution to the taxonomy problem with certain requirements (constraints) imposed on the description of each taxon.
Fig. 25. Combining the components of the mixture in taxa These requirements consist in the fact that the values of the characteristics of objects in one taxon have probability distributions of a given type. In our case, these are normal or binomial distributions. In some cases, this restriction can be circumvented. In particular, if the number of taxa is given Naturally, those components of the mixture that are the least spaced in the attribute space should be merged into one taxon. A measure of the separation component can be, for example, the Kullback measure
It should be noted that this measure is applicable only if the subset of values If we talk about the connection of the statistical approach to taxonomy with the previously considered deterministic methods, we can note the following. The FOREL algorithm is inherently close to approximating the distribution of a mixture of normal probability densities of characteristic values, and the mixture component covariations matrices are diagonal, the elements of these matrices are equal to each other, and the component distributions differ from each other only by their average values vectors. However, the same taxonomy result, even in this case, can be expected only with a large diversity of the mixture components. Combining several mixtures into one taxon according to the method is close to the empirical algorithm of KRAB 2. These two approaches complement each other. When the sample is small and the statistical methods are inapplicable or ineffective, it is advisable to use the algorithm KRAB, FOREL, KRAB 2. With a large sample size, statistical methods become more efficient, including combining the components of the mixture into taxa. |
| Evaluation of informative signs |
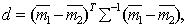
Evaluation of the informativeness of features is necessary for their selection when solving recognition problems. The selection procedure itself is practically independent of the way of measuring information. It is only important that this method be the same for all attributes (groups of attributes) included in their original set and participating in the selection procedure. Since the selection procedures were considered in the section devoted to deterministic recognition methods, we will not dwell on them here, but discuss only statistical methods for evaluating informativity. When solving recognition problems, the decisive criterion is the risk of losses and, as a special case, the probability of recognition errors. To use this criterion, it is necessary for each attribute (group of attributes) to conduct training and control, which is a rather cumbersome process, especially with large sample sizes. That is what is characteristic of statistical methods. Well, if the training is to build the distribution of the values of attributes for each image If there are training and control samples, the first one is used to build You can go the other way, namely: use the entire sample for training (building In this connection, other measures of informativeness of features that are calculated with less computational resources than the estimate of the probability of recognition errors are of interest. Such measures may not be linked one-to-one with error probabilities, but for choosing the most informative subsystem of signs this is not so significant, since in this case it’s not the absolute value of the risk of losses that is important, but the relative value of various signs (groups of signs). The meaning of the classification informativity criteria, as in the deterministic approach, consists in a quantitative measure of the “spacing” of the distributions of the values of attributes of various images. In particular, in mathematical statistics, estimates of Chernov’s upper classification error (for two classes), the associated Bhatachariya and Mahalanobis distances are used. For illustration, we give the expression of the Mahalanobis distance for two normal distributions, differing only in the average vectors
Where
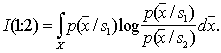
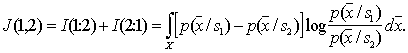
-1 - matrix reversal. In the one-dimensional case Let's take a closer look at the Kullback information measure as applied to a continuous scale of feature values. We define as follows the average information in space
It is assumed that there are no areas where Similarly Let's call the difference value
The greater the difference, the higher the classification information content of the signs. Obviously, when It is easy to make sure that if signs (indicative spaces) As an example, we calculate the discrepancy between two normal one-dimensional distributions with the same variances and different averages:
It turns out that in this particular case the discrepancy is equal to the Mahalanobis distance Intermediate calculations are invited to do yourself. |


 , but
, but  , then some taxa should be combined into one, which will have a different characteristic value distribution from the normal or binomial (fig. 25).
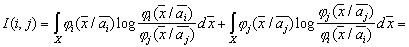

 , on which
  , but
, but  and vice versa, empty. In particular, this requirement is satisfied for normally distributed values of the characteristics of the mixture components.
  . Then if we managed to build
  in the original feature space, the distribution of any attribute (group of features) is obtained as a projection
  on the corresponding axis (into the corresponding subspace) of the original feature space (marginal distributions). In this case, retraining is not necessary; you just need to evaluate the probability of recognition errors. This can be done in various ways. Consider some of them.
  , and the second - to assess the probability of recognition errors. The disadvantages of this approach are the cumbersome calculations, since it is necessary to carry out object recognition a large number of times, and the need to have two samples: a training one and a control one, each of which has strict requirements for their volume. To form a large sample in practice is usually a difficult task, and two independent samples are even more so.
  ), and the control sample is generated by the sensor of random vectors in accordance with
  . This approach improves construction accuracy.
  compared to the previous version, but has other disadvantages. In particular, in addition to a large number of acts of recognition, it is necessary to generate the corresponding number of pseudo-objects required for this, which in itself is associated with certain expenditures of computing resources, especially if the distributions
  have a complex look.
  and
and  :
: 
 - covariance matrix,
  - matrix transposition,
 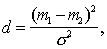 where you can see that
  the more, the more distant from each other
  and
and  and smaller distribution (less
  ).
).  to distinguish in favor
  vs
vs  :
: 
 but
but  , and vice versa.
 In other cases
  Indeed, if
  where in the area
  fair
fair  and in
  -
-  then
then 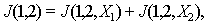 and
and  and
and  .
.  and
and  independent then


Comments
To leave a comment
Pattern recognition
Terms: Pattern recognition