Lecture
As previously noted, cluster analysis (self-study, unsupervised learning, taxonomy) is used to automatically generate a list of images from a training set. All objects of this sample are presented to the system without specifying which image they belong to. Such problems are solved, for example, by a person in the process of natural-science cognition of the surrounding world (the classification of plants and animals). This experience should be used to create appropriate algorithms.
The cluster analysis is based on the compactness hypothesis. It is assumed that the training sample in the attribute space consists of a set of bunches (like galaxies in the Universe). The task of the system is to identify and formally describe these clots. The geometric interpretation of the compactness hypothesis is as follows.
Objects belonging to the same taxon are located close to each other compared to objects belonging to different taxa. "Proximity" can be understood more broadly than with geometric interpretation. For example, a pattern describing the relationship of objects of one taxon differs from that in other taxa, as is the case in linguistic methods.
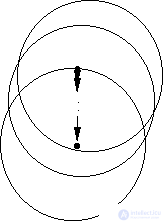
We confine ourselves to considering geometric interpretation. Let us dwell on the FOREL algorithm (Fig. 13).
a
b
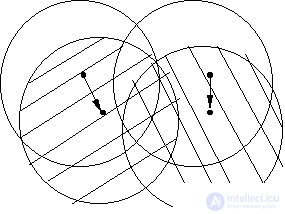
Fig. 13. Illustration of the FOREL algorithm:
a - the process of moving a formal element over a set
objects (points); b - illustration of the dependence of the results
taxonomy according to the FOREL algorithm from the starting point
move formal element
The hypersphere of radius is under construction  where
where  corresponds to the hypersphere covering all objects (points) of the training sample. In this case, the number of taxa
  will be equal to one. Then a hypersphere of radius is built.
  centered on an arbitrary sampling point. For the set of points that fall inside the hypersphere (formal element), the mean value of the coordinates (the standard) is determined and the center of the hypersphere moves into it. If this movement is significant, then the set of points that fall inside the hypersphere, and, consequently, their mean value of coordinates, will noticeably change. Again we move the center of the hypersphere to this new mean value, etc. until the hypersphere stops or loops. Then all the points that fall inside this hypersphere are excluded from consideration and the process is repeated on the remaining points. This continues until all points are exhausted. Taxonomy result: a set of radius hyperspheres (formal elements)
  with the centers defined as a result of the above procedure. Call it a cycle with formal elements of radius.
  .
.
The next cycle uses hyperspheres of radius.  . The parameter appears here.
  , determined by the researcher most often by selection in search of a compromise: increase
  leads to an increase in the rate of convergence of the computational procedure, but it also increases the risk of losing the subtleties of the taxonomic structure of the set of points (objects). It is natural to expect that with a decrease in the hypersphere radius, the number of selected taxa will increase. If in the feature space the training sample consists of
  compact bunches far apart from each other, starting from a certain radius
  several cycles with radii of formal elements
  will end with the same number
  taxa. It is reasonable to associate the presence of such a “shelf” in a sequence of cycles with an objective existence.
  bunches, which correspond to the taxa. The presence of several "shelves" may indicate a hierarchy of taxa. In fig. 14 shows the set of points that have a two-level taxonomic structure.
For all its visibility and interpretability of the results, the FOREL algorithm has a significant drawback: in most cases, the taxonomy results depend on the initial choice of the center of the hypersphere of radius  . There are various techniques that reduce this dependence, but there is no radical solution to this problem. Details can be found in the recommended literature [6].
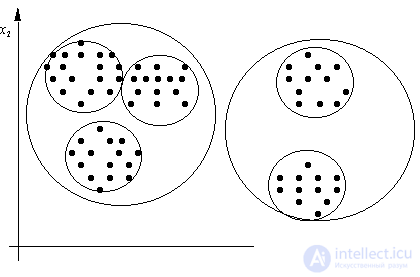
Fig. 14. Hierarchical (two-level) taxonomy
An example of the use of human criteria in solving taxonomy problems is the KRAB algorithm. These criteria are worked out on a two-dimensional attribute space in the course of a taxonomy implemented by a person, and are applied in an algorithm that functions with objects of arbitrary dimension.
The factors identified in the "human" taxonomy can be summarized as follows:
- within taxa, objects should be as close as possible to each other (generalized indicator  );
);
- taxa should be kept as far apart as possible (generalized indicator  );
);
- in taxa, the number of objects should be as equal as possible, that is, their difference in different taxa should be minimized (generalized indicator  );
);
- within taxa there should not be large jumps in the density of points, that is, the number of points per unit volume (generalized indicator  ).
).
If you can successfully choose the way to measure  and
and  then a good match between “human” and automatic taxonomy can be achieved. The KRAB algorithm uses the following approach.
All points of the training sample are combined into a graph in which they are vertices. This graph should have a minimum total length of edges connecting all vertices and not contain loops (Fig. 15). Such a graph is called a KNP-graph (KNP is the shortest non-closed path).
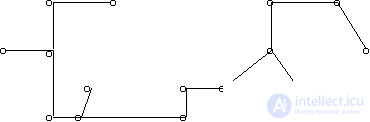
Fig. 15. Illustration of the KRAB algorithm
The measure of proximity of objects in one taxon is the average edge length
 ,
,
Where  - the number of objects in the taxon
  ,
,
 - length
  th edge.
Averaged over all taxa measure of proximity of points  .
.
The average length of the edges connecting taxa,  .
.
The measure of local heterogeneity is defined as follows.
If the length  th rib
  and the length of the shortest edge adjacent to it
  , the less
  , the greater the difference in the lengths of the edges, the more reason to believe that along an edge with a length
  will pass the border between taxa. Generalizing criterion
 ,
,
Where  - total number of points in the training set.
Determine the value  in the following way:
 .
.
It can be shown that with a fixed  maximum
  achieved when
  .
.
Now it is possible to form an integrated taxonomy quality criterion
 .
.
The more  However, this quality is higher. Thus, in implementing taxonomy, you need to strive to maximize
  . If you want to form
  taxa, it is necessary to break off in the CNR graph
  ribs such that the criterion
  turned out to be the maximum possible. This is a busting task. With a large number of taxa and learning sample objects, the number of options may be unacceptably large. It is desirable to reduce the computational cost. The following trick is offered as an example. KNP-graph is not built on the set of points of the training set, but on the set of hypersphere centers (taxa), found using the FOREL algorithm. This can dramatically reduce the number of vertices (and therefore the edges) of the graph and make it possible to carry out a complete search of the cliff variants.
  ribs. Of course, this is not guaranteed a global maximum.
  , especially if we recall the shortcomings inherent in the FOREL algorithm. This method of combining FOREL and KRAB algorithms is named by the authors KRAB 2.

Comments
To leave a comment
Pattern recognition
Terms: Pattern recognition