Lecture
Management is a dismemberment, analysis, definition of a sequence of actions, a concrete implementation. Management focuses on the bottom level: how do I do it the best way? This competence of the head determines the efficiency of movement along the chosen path. As a rule, managers who have emerged from programmers easily acquire the necessary managerial skills.
The basic schedule drawn up during the project planning stage serves as a guideline for monitoring the state of affairs at the macro level. For operational project management a work plan is used. Working planning is recommended to be carried out by the “oncoming wave” method: the work that needs to be done in the short term is planned in detail at the lowest level of the SRI, and far-away work is planned at a relatively high level of the SRI.
Elementary work is usually a separate functional requirement for a software product or a change request that has been consistently worked on: a business analyst, designer, developer, tester, and documentary. The complexity of the elementary work of each of the performers should be from 4 to 20 people. * Hour. If the complexity of the task does not fit into these limits, the work should be decomposed.
For work planning, it is advisable to use a task management or bug tracking system, since it allows you to set the sequence of task transitions from the contractor to the contractor, manage work priorities and adequately track their status: analysis, design, coding, testing, documentation. Work should be considered complete only when the implementation of the requirement is tested and documented.
Depending on the level of professionalism and maturity of the project team, the distribution of work can be carried out either directively with strict deadlines and monitoring the execution of each task, or these powers are delegated to the performers. In this case, they themselves choose tasks sequentially in accordance with priorities, and their implementation is analyzed periodically on the status of the rally. We can recommend weekly meetings on the project status of the whole team or, if the project is large enough, then its key private owners: subproject managers and team leaders. This is a good time for Monday morning, since the project participants, especially students who combine study and work, often work on weekends, but, of course, not because they rush through, but because it is more convenient for them. As a rule, only three questions are discussed:
As a rule, it makes no sense to estimate the percentage of work done in an intermediate state, because if the task is transferred to testing, this does not mean that 70% of the work is done. At the testing stage, a design error can be identified and all the work will start anew. The recommendation is to use the “50/100” rule. If the work on the task has been started, then it should be considered as completed by 50%. And only tested and documented work teaches 100%.
"That which cannot be measured cannot be controlled." Project measurements should be performed regularly, at least once every 1-2 weeks. For each measurable indicator, its planned values should be determined. For each plan value, three areas of critical deviations should be defined:
Measurements must be made regularly. The goal is to identify the causes of occurring or possible critical and unacceptable deviations. The result of the analysis should be the planning of corrective actions to compensate for unacceptable deviations, their implementation and monitoring the effectiveness of the application of these corrective actions.
All measurements must be stored in the project repository. Measurements accumulated during the project are the most reliable basis for a detailed assessment and planning of work at the next project iterations.
Since the main task of the manager is to keep the project within the “iron” triangle, then, first of all, it is necessary to analyze the deviations of the project in terms of time and costs. This is done using the method of mastered volume [1]. We had to deal with the opinion that this method is not applicable in the management of software projects. This is true if we use the waterfall model of the development process. But if the project's SRI is focused on incremental development, this means that at the top levels of decomposition are the components of the project product and their functionality, and not production processes. Therefore, if the project is implemented, tested and documented 50% of the functional requirements, then there is every reason to believe that approximately half of the design work remained.
The essence of the project evaluation method for mastered volume is as follows. First, the deviation from the SV (Shedule Variance) graph is measured in monetary units:
SV = EV - PV,
Where
For example. Suppose we have currently implemented (tested and documented) 20 functional requirements, for each of which it was planned to spend 40 people * hour. 1000 rubles, then the mastered volume will be
EV = 20 * 40 * 1000 = 800,000 rubles.
If at the moment it was planned to implement only 15 requirements, then the planned volume will be
PV = 15 * 40 * 1000 = 600,000 rubles.
Consequently, we are ahead of the graph (positive deviation from the graph) by
SV = EV - PV = 800 000 - 600 000 = 200 000 rubles.
How to translate the deviation from the schedule, expressed in monetary units, into a reduction in the project timeline is illustrated in Figure 43.
If we are ahead of the schedule, this does not necessarily mean that the project is going well. Good or bad depends on the value of another indicator of the method of mastered volume: CV (Cost Variance) - deviations in costs, which is estimated by the formula:
CV = EV - AC
Where
For example, if we, in order to reduce the time of work on the project, worked 25% of the time overtime and on weekends with double pay, then the actual labor costs were:
AC = 20 * (30 * 1000 + 10 * 2000) = 1,000,000 rubles.
Therefore, deviations in costs in our case will be
CV = EV - AC PV = 800 000 - 1 000 000 = - 200 000 rubles.
A negative value deviation means that we have exceeded the budget, which, in general, is not very good. But if the project completion date has the highest priority for us, and our projected costs upon completion of the project do not exceed the planned ones, taking into account the management reserve (Figure 43), in this case, we can assume that the project is being carried out successfully.
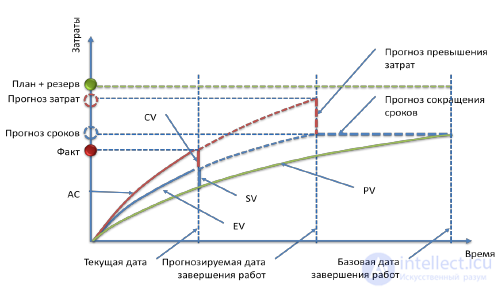
Figure 43. Estimation and forecast of indicators by the method of mastered volume
Deviation from the budget and in terms of absolute monetary units is not enough to characterize projects of different scales. More illustrative relative indicators: Schedule Performance Index ( SPI )
SPI = EV / PV
and cost performance index ( CPI )
CPI = EV / AC,
which characterize the project regardless of its size. If the values of both indices are greater than 1, then this indicates a positive state in the project.
What other measurable indicators should be used in managing a software project?
First of all, this is an indicator of project progress, the proportion of implemented and verified high-level project requirements, for example, the ratio of the number of completed product use scenarios to their total number.
Another indicator is the stability of the project, the total number of changes (approved by the sponsor or customer) in the project management plan. The higher the instability in the project, the greater the difficulty in managing the work and the lower the productivity of the participants.
If someone thinks that the code is a solution to the problem, then it is not. The code is a new source of problems. Therefore, you should always measure the current size of the project - the number of lines of source code added, modified and deleted during the execution of a software development project. The larger the amount of source code, the longer it will take to make changes and correct errors.
As the volume of a project product increases, the effort for each new line of source code increases. If we take the performance of a project team for the nominal production of a product at 10 KSLOC, then the same team on a project at 100 KSLOC will show a performance of 1.3–1.7 times less, and at a project of 1000 KSLOC, we should expect that productivity will decrease 1.6–3.0 times 2].
A large amount of code will also require more people to maintain it. Since, even if only a few critical errors are detected per year, in order for them to be fixed within a reasonable time frame, for example, in 24 hours, in a product with a total volume of 1000 KSLOC, then one programmer cannot cope with this. This is due to the fact that in order to correct the error in a limited time it is necessary to quickly identify and eliminate its cause, and for this you need to know the architecture and code of the software product. In order to effectively accompany a product of this size, it is necessary to have about 20 developers in the “hot” reserve, because 50 KSLOC, in my opinion, is the maximum amount of code that one person can keep in mind and effectively accompany. And another problem: what these people take in their free time from error correction, if there are no new product development projects.
The next important indicator of the state of the project is the average performance, the ratio of the current size of the project to the actual costs of the project. S. McConnell [2] gives the following indicators (minimum, maximum and average) productivity in KSLOC per person * months. actual costs for standard project types of 100 KSLOC:
High performance in the project is not always a good sign. We had to meet with projects in which, due to the active use of the “copy + past” method, the average productivity in the development of a business system reached 2000 SLOC / person * months. However, for the implementation of the required functionality, 3-4 times more code was written than would be required if the architecture was adequately worked out.
Another group of quantitative indicators that should be observed during the project implementation characterizes the quality of a software product:
It should be emphasized that it is necessary to observe the average values of the indicators for the project, and in no case should not try to measure individual characteristics of productivity and quality. The main reasons why this should not be done are that, firstly, in this case, instead of coordinated teamwork, we will receive personal competition, and, secondly, the most “advanced” developers will work on formal indicators, and not to achieve the objectives of the project.
If the team really took place, then it is characterized by collective responsibility for achieving common goals. And, as T. Demarko writes [3], “the project manager must take a turn to criticize an employee who does not fulfill his promises,” since there will always be a lot of people for that in the right team.
The main objective of this phase is to verify and transfer the project result to the customer. To do this, it is necessary to perform the acceptance work in accordance with the acceptance procedure, which must be determined in advance at the very early stage of the project.
Project results should be transferred to the implementation or maintenance, or properly mothballed for future use. There should not be "stuck" project work. All line managers of all participants must be notified of the completion of the project, and the release of employees.
An important task that should be solved at this phase is the implementation of feedback on the project. The goal is to preserve the results, knowledge and experience gained in the project for more efficient and high-quality implementation of similar projects in the future. It is necessary to archive all the results, document the experience, lessons on the project and suggestions for improving the technology of work execution and project management.
All projects and especially failed projects should end with a final report if the company does not want to “step on the same rake”. Remember that "yesterday's problems are today's risks."
The final report should contain the following information:
In the completion phase, it is desirable to implement the motivation plan for the project team members, since the deferred remuneration motivates significantly less.
For operational project management a work plan is used. Elementary work is usually a separate functional requirement for a software product or a change request that has been consistently worked on: a business analyst, designer, developer, tester, and documentary.
Project measurements should be performed regularly, at least once every 1-2 weeks. For each measurable indicator, its planned values and tolerances should be determined.
The composition of the measured indicators should include the following project characteristics:
According to the results of the project must be implemented feedback. The goal is to preserve the results, knowledge and experience gained in the project for more efficient and high-quality implementation of similar projects in the future.
The job of a project manager is similar to that of a gardener.
Just as the gardener lovingly selects the most suitable plants for his future garden, the manager recruits the people who are most relevant to the goals of the project.
Just as the gardener is looking for the best soil for each plant, taking into account its features, the manager for each member of the project team is looking for the most suitable task for him.
Just as the gardener carefully cherishes his pets, protects them from harmful influences, ensures that no plant shades the other, but only complements it and contributes to its growth, the project manager patiently works with each member of the project team, promoting his proper development, protecting it from external and internal shocks, in order to maximize its individual abilities and increase the return on them, notes with satisfaction every new achievement.
“What you sow, you reap” - this law is equally applicable both to the work of a gardener and to the work of a project manager.Neglect of people will only generate reciprocal neglect. Put a part of your soul in people, and you will be rewarded a hundredfold.

Comments
To leave a comment
software project management
Terms: software project management