Lecture
Steve McConnell [1] writes that we are naturally inclined to believe that complex formulas of the form
always provide more accurate results than simple formulas
Labor input = Number of Factors x Average Expenses On Factor
However, this is not always the case. Complex formulas, as a rule, are very sensitive to the accuracy of a large number of parameters (in the example given, COCOMO II formulas contain 21 parameters), which must be specified in order to obtain the required estimates.
The first thing to understand when evaluating a project is that any assessment is always a probabilistic statement. If we just say that the complexity of this work package is M people * months. (Figure 34), this will be a bad estimate because a single number will not tell us anything about the probability that the implementation of this package will take no more than M persons * months. It is unlikely that we can consider ourselves to be “predictors” who know exactly what will happen in the future and how much it will cost to implement this package of work.
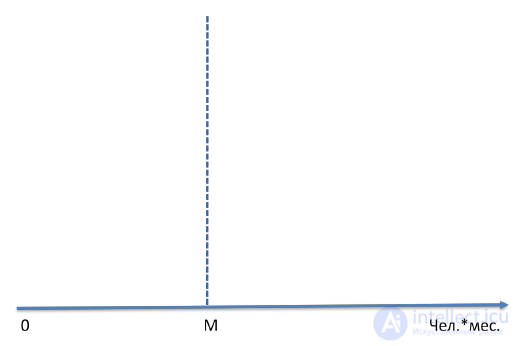
Figure 34. The point estimate of the complexity of the work package will not tell us anything about the likelihood that the implementation of this package will require no more than M people * months.
In order to understand where the uncertainty comes from, let us consider the simplest example, let us try to assess the complexity of adding a field to enter the customer’s phone number to an already existing form. The manager, observing the work of programmers only from the side, will say that this work will require no more than 15 minutes of working time. A person experienced in programming experience will say that this work can take from 2 to 200 hours, and in order to give a more accurate assessment he needs to get answers to a number of questions:
Calling such a “fuzzy” assessment, an experienced programmer reserves all development risks associated with the listed uncertainties of this requirement, which he is forced to accept, not having the necessary clarifying information at the given moment.
The fact that our estimate should be a probabilistic statement means that there is a certain probability distribution for it (Figure 35), which can be very broad (high uncertainty) or rather narrow (low uncertainty).
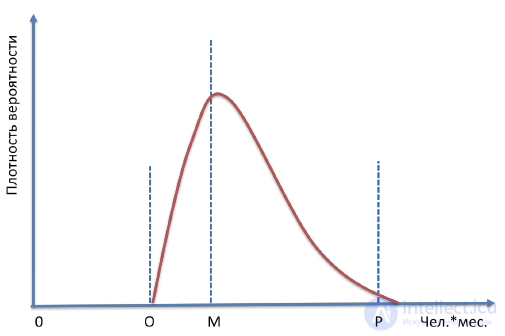
Figure 35. Estimation is always a probability value.
If M is the most likely value, then this does not mean that it is a good estimate, since the probability that the actual workload will exceed this estimate is more than 50%.
What score can be considered good? Steve McConnell states [1]: “A good assessment is considered to provide a sufficiently clear picture of the real state of the project and allows the project manager to make good decisions on how to manage the project to achieve the goals.”
In software engineering, it has already become commonplace that developers, without sufficient reason, call too optimistic terms. Among managers, even the unwritten rule is common: to multiply by 2 the estimate of the labor intensity that the programmer has made. This is a pessimistic approach. Realists multiply by π = 3.14 .
Indeed, sometimes you have to do this if it is a programmer who just debugged his first program “Hello world!” Yesterday. But if you help young professionals learn to analyze a problem, design a solution, draw up a work plan, effectively implement it and analyze the results, you can not remember what the number π is .
Another common source of underreporting is unreasonable expectations for the use of new technologies and development tools. These expectations, as a rule, are not met. According to statistics provided by DeMarco, the average productivity in software production is growing only by 3-5% per year.
Often, an “aggressive” project schedule arises from the fact that the management and / or customer are afraid to overestimate the project, assuming that, according to the Parkinson law, the project will take all the time allotted to it. The consequence of such concerns is, as a rule, a directive understatement of the timing of the project.
Unrealistic ratings are one of the most serious demotivating factors for participants. Underestimation leads to planning errors and inefficient interaction. For example, testing was scheduled, and the release is not ready yet. The consequence is simple testers increase in labor costs.
If the schedule is too aggressive, then in order to save time, not enough attention is paid to requirements analysis and design. Correction of errors made at these stages will lead to significant additional costs.
Half of all programming errors are due to the stress caused by the excessive pressure of the timing factor. Errors are corrected in a hurry, workarounds. The result will be a large problem code and the ever-increasing costs of correcting errors and making changes. Later, the detection of errors leads to the fact that the cost of correcting them increases 50–100 times.
I had to observe a project that instead of the originally too optimistic six months, was stretched for three years. Although, if it were adequately assessed, it could be implemented in one year. Unrealistic deadlines, constant pressure, overtime, and rush jobs lead to the fact that project costs grow exponentially and indefinitely.
If the participants of the project team are adequately motivated to carry out project work at the lowest possible cost, then, in my opinion, this is enough for the project to be implemented in the shortest possible time. We will talk about motivation (see Lecture 7. Forming a team).
Using your own experience or the experience of colleagues obtained in similar projects is the most pragmatic approach that allows you to get quite realistic estimates of the complexity and duration of the implementation of a software project, quickly and without high costs.
The engineering method for estimating the labor intensity of the PERT project (Program / Project Evaluation and Review Technique) was developed in 1958 during the Polaris sea-based ballistic missile project. The entry for this assessment method is a list of elementary work packages. For the engineering approach, it is not necessary to know precisely the distribution law of our estimate of the complexity of each such elementary package. It is enough to characterize the range of uncertainty with three estimates:
Estimation of the average complexity for each elementary package can be determined by the formula:
Ei = (Pi + 4Mi + Oi) / 6.
To calculate the standard deviation, the formula is used:
CKOi = (Pi - Oi) / 6.
If our estimates of the complexity of elementary work packages are statistically independent, and not corrupted, for example, by unjustified optimism, then, according to the central limit theorem of probability theory, the total complexity of a project can be calculated using the formula:
E = ∑ Ei
And the standard deviation to estimate the total labor intensity will be:
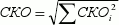
Then, to estimate the total complexity of the project, which we will not exceed with a probability of 95%, you can apply the formula:
E 95% = E + 2 * RMS.
This means that the probability that the project will exceed this estimate of labor intensity is only 5%. And this is a completely acceptable estimate, under which a professional manager can sign.
The list of elementary work packages that is used in the assessment of labor intensity is usually taken from the bottom level of the SRI project. But the accumulated experience of similar developments can be used. I will illustrate this approach on the example of a real project. At CBOSS, the task of the project, which we and our colleagues were fortunate to implement, was the development of system-wide software based on J2EE standards for converting CBOSS jobs to a new three-tier architecture. A set of standard components and services was developed, from which, as a designer, you can efficiently and efficiently assemble application subsystems. The high-level architecture implemented the standard MVC pattern (Figure 36), each of the components of which had “extension points” for application development, which are highlighted in red in the figure.
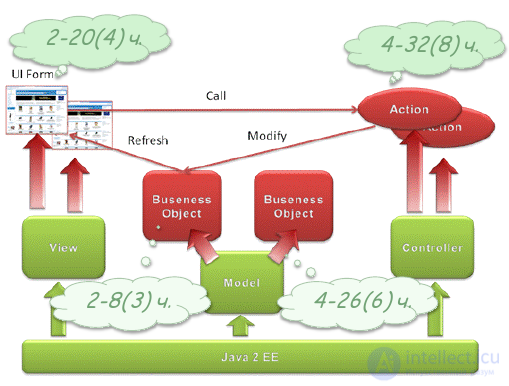
Figure 36. High-level architecture J2EE application development framework.
These points of expansion were:
So, although all the developed workplaces differed in terms of functionality and complexity, the accumulated statistics of actual labor costs for the development of application systems allowed us to evaluate projects to develop a new application fairly quickly and with high accuracy.
According to these statistics, development and debugging required the programmer:
The whole project of applied development was measured in "parrots":
If the new application being developed contains 20 custom screens, 60 event handlers, 16 new business objects and 40 new business methods that need to be added to both new and existing business objects, then, according to our statistics,
| Е UI = (2 + 4 * 4 + 20) / 6 = 6.7 people * hours,
Е Act = (4 + 4 * 8 + 32) / 6 = 11.3 people * hour, Е BO = (2 + 4 * 3 + 8) / 6 = 3.7 people * hour, E BM = (2 + 4 * 6 + 26) / 6 = 8.7 people * hour, |
RMS UI = (20 - 2) / 6 = 3 people * hour
RMS Act = (32 - 4) / 6 = 4.7 people * hour CKO BO = (8 - 2) / 6 = 1 person * hour RMS BM = (26 - 2) / 6 = 4 people * hour |
For the average complexity of work on coding in the project can be obtained the following estimate:
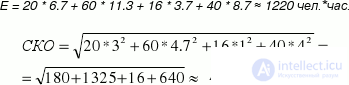
Then, to estimate the total labor intensity of the project, which we will not exceed with a probability of 95%, we get
E 95% = 1220 + 2 * 46 ≈ 1300 people * hour.
Although the relative error in estimating the labor intensity of each such elementary work was tens of percent, for our project in which there were 136 such “parrots”, the relative error in estimating the total labor input made by the PERT method was approximately only 4%.
Even if we have very vague estimates of the laboriousness of each of the elementary works, but they are independent, we make mistakes in both the smaller and larger sides. Therefore, during the actual implementation of the project, these errors will be compensated, which allows us to estimate the total labor costs for the project significantly more accurately than the labor costs for each elementary work. But this statement will be true only if our SRI contains all the necessary work that must be performed to obtain all the products of the project.
The resulting estimate of the complexity of coding must be multiplied by four, because we remember (see Lecture 3. Initiation of the project) that the coding makes up only 25% of the total labor costs of the project. Therefore, the total complexity of our project will be approximately 5,200 people * hour.
As we said earlier, if an employee is 100% assigned to a project, this, as a rule, does not mean that he will spend 40 hours a week on design work. He will spend 60–80% of his working time. Therefore, in a month the employee will work on the project, approximately, 165 * 0.8 = 132 people. * Hour / month. Consequently, the complexity of the project in person-months will be approximately 5200/132 ≈ 40.
Then, according to the B. Boehm formula (Figure 15), the optimal project duration will be:
T = 2.5 * (40) 1/3 = 8.5 months,
and the average team size is 5 people.
We remember that resource consumption in a project is uneven (Figure 13), therefore, 1-3 people should start a project, and at the implementation stage, the initial number of the team can be increased several times.
If there is no own experience of similar projects, and expert colleagues are not available, then we have no choice but to use formal methods based on generalized industry experience. Among them, the most common are two approaches:

Comments
To leave a comment
software project management
Terms: software project management