Lecture
Project risk is the cumulative effect of the likelihood of occurrence of uncertain events that can have a negative or positive impact on the project objectives [23]. Risks are divided into known and unknown. Known risks are identified and subject to management - plans for responding to risks and reserves for possible losses are created. Unknown risks cannot be identified, and therefore it is impossible to plan actions to respond to such a risk .
A risk event is a potential event that could harm or bring benefits to the project [23].
The probability of occurrence of a risk is the probability that a risk event will occur [23]. All risks have a probability greater than zero and less than 100%. Risk with a probability of 0 cannot occur and is not considered a risk . Risk with a probability of 100% is also not a risk , since it is a reliable event that must be provided for in the project plan.
The consequences of risk , if it happens, are expressed through the days of the schedule, labor costs, money and determine the degree of impact on the objectives of the project .
The magnitude of the risk - an indicator that combines the likelihood of risk and its consequences. The magnitude of the risk is calculated by multiplying the probability of occurrence of the risk by the corresponding consequences.
Contingency reserve (or reserve to cover uncertainty) - the amount of money or a period of time that is needed in excess of the calculated values to reduce the risk of overspending associated with achieving the objectives of the project, to the level acceptable to the organization; usually included in the baseline cost plan or project schedule .
A management reserve is an amount of money or a period of time that is not included in the baseline cost plan or project schedule and is used by management to prevent negative consequences of situations that cannot be predicted.
Risk response planning includes the development of a risk management plan - a document developed at the beginning of the project and representing a schedule for working with risks throughout the life cycle of a project. The plan contains the following information [18].
Methodology - defines and describes the approaches, tools and data sources used to work with risks .
Roles and Responsibilities - this section contains a description of who does what work during project risk management .
Budgeting - defines a budget for managing project risks .
Timeframes — set the frequency of risk management processes.
Tools - the section determines which methods of quantitative and qualitative risk analysis are recommended to apply and in what cases.
Control is a section that defines the format of a risk response plan.
Reporting - defines ways of documenting the results of risk management actions and storing information in the knowledge base to gain experience and learn lessons.
An example of the methodology is the risk management discipline MSF (Microsoft Solutions Framework) [11]. MSF describes the process of continuously identifying and assessing risks , prioritizing them, and implementing strategies for preventive risk management throughout all phases of a project's life cycle .
Project risk management methods for small and medium-sized projects are sufficiently developed and can effectively reduce the level of risks and project labor costs (see Table 9.1). For managing large-scale projects, the “standard” set of methods is not enough [15].
Table 9.1. Risk Management Examples
|
Scale of the project |
Number of works |
Number of subprojects |
Work connectivity |
Management methods |
|
Small |
too |
Not |
Low |
PMF 1 FMEA MSF, Personal Experience Manager |
|
Average |
50-100 |
Units |
Low, medium |
Standard Techniques (ASAP 2 PJM 3 PMI), SPICE 4 COBIT |
|
Large |
100-1000 |
From several dozen to several hundred |
High |
Worked poorly |
Risk assessment is recommended to start at the planning stage of the project, because at this moment the project team and interested parties begin to form a vision of the project, its boundaries and frameworks. With each new limitation or assumption associated with the project, an increasing number of risks begin to appear. The project team should initiate risk detection activities as early as possible. Based on the results of the risk analysis and planning steps, the necessary mitigation and mitigation plans should be immediately included in the project schedule and its master plan. The implementation of these plans should be monitored as part of the standard project management process [11].
At the planning stage, in accordance with the adopted policies and procedures in the risk management process , the organization should take the following actions:
The system approach involves the introduction of risk classification, the definition of events that affect the course of the project and its results, the definition of how to express risks . In terms of quality, cost, timing, or technical characteristics, they determine how to express risks in appropriate terms, including indicators where possible;
This action includes the definition of initiating events associated with each risk in each of the risk categories, as well as identifying the relationships between the sources of risk . Determine the way of expressing risks in appropriate terms and, if possible, in terms.
The overall definitions of probability levels and exposure levels are adapted separately for each project during the risk management planning process and are used in the qualitative risk analysis process. You can apply a relative scale on which the probability is designated descriptively, with values ranging from “extremely unlikely” to “almost surely”, or a scale on which probability corresponds to a numerical value, for example: 0.1 - 0.3 - 0.5 - 0, 7 - 0.9. In tab. 9.2 presents a seven-level probability division [11]. For each probability interval, a relative and numerical estimate is made.
When assessing the impact of a risk, the potential effect it may have on the project's goal (for example, time, cost, content or quality) is determined. In tab. 9.3 presents a scale for assessing the threat of risk, defined in monetary terms.
Table 9.2. Seven-level risk probability assessment
|
Probability interval |
Probability value used for calculations |
Verbal wording |
Numerical score |
|
From 1% to 14% |
7% |
extremely unlikely |
one |
|
From 15% to 28% |
21% |
low probability |
2 |
|
From 29% to 42% |
35% |
probably not |
3 |
|
43% to 57% |
50% |
50-50 |
four |
|
From 58% to 72% |
65% |
possibly |
five |
|
From 73% to 86% |
79% |
very plausible |
6 |
|
From 87% to 99% |
93% |
almost certainly |
7 |
Table 9.3. Scale for assessing the effects of risk , measured in money
|
Evaluation |
Money expression |
|
one |
up to $ 100 |
|
2 |
$ 100- $ 1000 |
|
3 |
$ 1000- $ 10,000 |
|
four |
$ 10,000- $ 100,000 |
|
five |
$ 100,000- $ 1,000,000 |
|
6 |
$ 1,000,000- $ 10 million |
|
7 |
$ 10 million- $ 100 million |
|
eight |
$ 100 million- $ 1 billion |
|
9 |
$ 1 billion- $ 10 billion |
|
ten |
over $ 10 billion |
When monetary units cannot be applied, the project team may use other risk impact assessment scales (see Table 9.4). The impact assessment system should reflect the policies and values of the organization and project team.
Table 9.4. Scale for assessing the consequences of risk , as measured by deviations in the cost , timing and technical conditions of the project
|
Evaluation |
Cost overruns |
Calendar schedule |
Technical conditions |
|
1 (low) |
up to 1% |
1 week shift |
slight loss of performance |
|
2 (average) |
up to 5% |
2 week shift |
moderate decrease in productivity |
|
3 (high) |
to 10% |
1 month shift |
severe performance damage |
|
4 (critical) |
from 10% |
shift more than 1 month |
task cannot be completed |
Table 9.5. Scale impact assessment for four project objectives
|
Certain conditions for the scale of assessment of the degree of potential risk impact (only examples of negative impacts are shown) |
|||||
|
Objective of the project |
Values shown are relative and numeric |
||||
|
Very low |
Low |
Moderate |
High |
Very high |
|
|
0.05 |
0.10 |
0.20 |
0.40 |
0.80 |
|
|
Cost of |
Slight increase |
Increase <5% |
An increase of 5-10% |
An increase of 10-20% |
Increase> 20% |
|
Timing |
Slight increase |
Increase <5% |
An increase of 5-10% |
An increase of 10-20% |
Increase> 20% |
|
Content (volume) |
Changes are invisible |
Minor changes |
Significant changes |
Unacceptable change for client |
Achievement of the final results is impossible |
|
Quality |
Changes are invisible |
Minor changes |
Changes require customer approval |
Unacceptable change for client |
Achievement of the final results is impossible
|
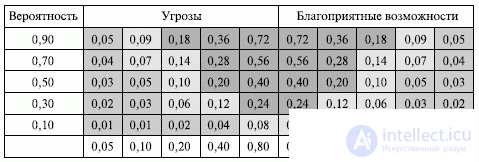
Fig. 9.1. Impact matrix (probabilities and consequences) of risks
The relative scale of consequences is developed by each organization independently. The scale contains only descriptive designations, for example, "very low", "low", "medium", "high" and "very high", arranged in ascending order of maximum risk force according to the definition of the organization. The same can be done differently, by assigning to these consequences digital values that can be linear and non-linear, for example, 0.1 - 0.3 - 0.5 - 0.7 - 0.9 or 0.05 - 0.1 - 0.2 - 0.4 - 0.8. In tab. 9.5 presents both relative and digital (in this case non-linear) ways of identifying the consequences of risk for the four objectives of the project [23].
The scale of impact levels is the basis for constructing a matrix of probability and consequences.
The matrix of probability and consequences contains combinations of probability and impact, with the help of which a certain rank is assigned to risks: low, medium or higher [23]. The matrix may contain descriptive terms or numerical designations (see Fig. 9.1) and is based on the scales of probability assessment and assessment of the degree of influence of a possible risk. The left column of the matrix contains the values of the probability of occurrence of risk, the first line contains a scale with the values of possible consequences. The cells are filled with the results of multiplying the values of these scales. Comparing the value of the matrix cell with the impact assessment scale, the risks can be divided into categories: small, medium and large. Consider the matrix of probability and consequences presented in Fig. 9.1. Risks that have a very high probability, but minor consequences, as well as risks that have a low probability and minor consequences, are considered to be risks that do not have an impact (cells of the gray color table). Risks with very high consequences, but low probability, as well as risks with minor consequences and high probability (light gray cells), have an average impact on the project. Risks to which it is necessary to pay special attention have a rather high probability and significant consequences (the cells of the table are painted in dark gray).
To identify risks using the following methods [11,23].
Brainstorming . The goal of brainstorming is to create a detailed list of project risks . The list of risks is developed at a meeting in which 10-15 people participate - members of the project team, often together with experts from different areas who are not members of the team. Meeting participants call risks that are considered important for the project, while discussion of the risks put forward is not allowed. Next, the risks are sorted into categories and clarify.
The Delphi method is similar to the brainstorming method, but its participants do not know each other. The moderator, using a list of questions to get ideas about the risks of the project, collects expert answers. Further, the experts' answers are analyzed, categorized and returned to the experts for further comments. Consensus and a list of risks is obtained through several cycles of this process. The Delphi method eliminates peer pressure and the fear of an awkward position in expressing an idea.
The method of nominal groups allows identifying and ranking risks in order of their importance. This method involves the formation of a group of 7-10 experts. Each participant individually and without discussion lists the risks of the project visible to them. Further, there is a joint discussion of all identified risks and the re-individual compilation of a list of risks in order of their importance.
Crawford cards . A group of 7-10 experts usually meets. The moderator states that he will ask the group 10 questions, each of which the participant must give an answer in writing on a separate sheet of paper. The question of which of the risks is the most important for the project, the leader asks several times. Each participant is forced to consider ten different risks of the project.
Surveys of experts with extensive experience working on projects.
Identification of the root cause . The purpose of this process: to identify the most significant causes of risks of the project and group the risks for the reasons that cause them.
Analysis of strengths and weaknesses, opportunities and threats ( SWOT analysis ). The purpose of the analysis is to assess the potential and environment of the project. The potential of the project, expressed in the form of its strengths and weaknesses, allows us to estimate the gap between the content of the project and the possibilities of its implementation. An assessment of the project’s environment shows what kind of opportunities it provides and what dangers the external environment threatens.
Analysis checklists . Checklists are lists of risks , compiled on the basis of information and knowledge that have been accumulated during the execution of previous similar projects.
The method of analogy . To identify risks, this method uses the accumulated knowledge and risk management plans of other similar projects.
Methods using charts . The methods of displaying risks in the form of diagrams include diagrams of cause-effect relationships and flowcharts of processes that allow you to follow the sequence of events occurring in this process.
Table 9.6. Comparison of risk identification methods
|
Identification method |
Benefits |
disadvantages |
|
Brainstorm |
Facilitates the interaction of group members. Fast. Inexpensive |
May manifest the predominance of one person. You can focus only in specific areas. Requires a strong lead. For evaluation, it is necessary to control the propensity of the group |
|
Delphi method |
No dominance of one person. It can be carried out remotely via email. Eliminates the problem of early evaluation. Requires the participation of each member of the group |
Takes a lot of time. High master load |
|
Nominal group method |
The effect of the dominant personality is reduced. Provides interaction of participants. Gives an ordered list of risks |
It takes a lot of time. High master load |
|
Crawford cards |
Fast. Easy to implement. Must participate every member of the group. Produced a large number of ideas. Can be carried out with larger groups. Reduces the effect of the dominant personality |
Less interaction between participants |
|
Expert survey |
Used past experience |
An expert may be biased. Time consuming |
|
Checklists |
Concrete and orderly. Easy to use |
Bias. May not contain specific elements for this project. |
|
Analogy method |
Uses past experience to eliminate problems in the future. Similar projects contain many similarities. |
It takes a lot of time. It is easy to get results that are not suitable for this case. Analogy may be incorrect |
|
Methods using charts |
A clear view of the processes involved. Ease of construction. There are many computer tools for them. |
Sometimes misleading. Can take a lot of time |
A comparison of the project risk identification methods [11] is presented in Table. 9.6.
The identified risks are documented in the so-called risk registries.
Examples of risk register templates [11] are given in Tables 9.7 and 9.8.
In more complex projects, where there is a need to ensure high quality results with a large number of jobs, it is common to use extended risk registries and immediately indicate the expert assessment of the impact of risk on the project (see table 9.9).
Table 9.7. Risk register template
|
RISK IDENTIFICATION |
||||||||
|
No |
Damage to the risk |
Data Registration |
Risk name and description |
Initiator |
The reasons |
Effects |
Risk owner |
The expiry date of the risk |
|
. |
||||||||
|
. |
||||||||
Table 9.8. Example of filling risk register (simplified)
|
Root cause |
Condition |
Aftermath |
|
Insecurity staffing |
Project roles can be combined. Incompatible roles: quality manager and developer, tester and developer |
Combining roles can make it difficult to monitor and evaluate results, which will reduce the quality of the software product. |
|
Technology changes |
Developers will have to master new technologies and use them for the first time. |
Increase the time to develop a software product. Possible reduction in quality ________ |
|
Work organization |
Project participants are geographically removed |
The exchange of information within the group is difficult. Time to achieve project goals increases _____ |
Table 9.9. An example of completing an extended risk log
|
Risk type |
Risk description |
Proactive activities |
Reactive events |
Probability |
Effects |
Risk factor |
|
Technological |
The customer may delay the release of the product due to constant changes and additions to product requirements |
1. Разделить требования на "абсолютно необходимые" и "хорошо бы было иметь", до запуска системы выполнять только абсолютно необходимые требования 2. Убедиться в том, что руководство заказчика понимает и поддерживает подход, что заявки на изменения будут выполняться после завершения основных работ везде, где это возможно |
1. Обсудить изменение сроков ввода системы в эксплуатацию из-за накопившегося объема изменений для обеспечения необходимого уровня качества финального продукта |
eight |
6 |
48 |
|
Financial |
Заказчик настаивает на бесплатном исправлении всех ошибок (в данном случае речь идет только о тех пунктах, которые мы также можем признать ошибками), что может привести к серьезным финансовым потерям |
1. Включить в план работ бюджет и время программистов на исправление ошибок по результатам тестирования. 2. Explain to key customer representatives that error detection and correction is part of software development technology. |
1. If it is impossible to reach an agreement, raise the issue to the level of the steering committee |
eight |
6 |
48 |
According to ISO 15288, the control process includes the following actions:
Accounting includes determining the current understanding of risks and attitudes towards measures and resources related to risk response. Such an account allows you to track the risk history, which helps in making decisions and can be an example for designing future systems.
Для обеспечения контроля и управления рисками на этапе планирования разрабатывают план реагирования на риски, шаблонкоторого представлен в табл. 9.10.
План реагирования на риски оценивает риски, определяет действия по увеличению числа благоприятных возможностей и сокращает вероятность влияния на проект отрицательных воздействий, обеспечивает готовность к возможным неблагоприятным воздействиям.
План реагирования на риски помогает детально проанализировать множество неопределенностей и обратить особое внимание на области проекта, имеющие наивысшие значения рисков, а также изыскать эффективные способы снижения рисков. Использование плана предоставляет возможность интеграции рисков непосредственно в процессе планирования и исполнения проекта и обеспечивает лучшее понимание целей проекта, содержания и хода исполнения. План также содержит информацию, необходимую для обоснования планирования действий в непредвиденных ситуациях, раннего предупреждения рисков и более реалистичного подхода к исполнению проекта [18].
Таблица 9.10. Пример шаблона плана реагирования на риски
|
План реагирования на риски |
||||||||||
|
Название проекта: |
Дата оценивания: |
|||||||||
|
Пакет работ |
Описание риска |
Вероятность возникновения риска |
Степень тяжести воздействия |
Статус события риска |
Степень критичности |
Номер затрагиваемого риском события |
Превентивные действия |
Пороговое значение |
Реактивные действия |
Владелец риска |
На рассматриваемой стадии ЖЦ ИТ наиболее вероятно возникновение рисков, вызванных следующими обстоятельствами [22]:
1. неправильно определена область применения проекта;
2. не определен спонсор проекта;
3. не разработана стратегия реагирования на риски ;
4. не определены ожидания участников проекта;
5. не установлена ответственность за обеспечение проекта материальными и финансовыми ресурсами.
Для смягчения последствий от рисков, вызванных вышеперечисленными причинами, рекомендуется в уставе проекта и определении проекта четко определять цели и результаты проекта, основные допущения и предположения, как со стороны заказчика, так и со стороны исполнителя, документально закреплять полномочия и ответственности между участниками проекта. Также необходимо определить степень участия в организации выполнения проекта заказчика, спонсора проекта и лиц, принимающих решение со стороны заказчика, и согласовать и документировать процедуры управления рисками проекта. Исполнителем должен быть выполнен анализ рисков, идентифицированных на стадии подготовки ТЭО проекта, с целью обеспечения резервных средств при планировании проекта и разработке мер по смягчению воздействий от возникновения рисков. Для снижения рисков проекта на ранней стадии планирования необходимо включить в план по материальным ресурсам необходимые требования к инфраструктуре проекта и согласовать с заказчиком области инфраструктуры, за котор ые он несет ответственность.
В работе [15] предложена модель управления рисками крупного проекта. В рамках предлагаемой модели проект рассматривается как множество взаимосвязанных процессов, которые сгруппированы по фазам. Такая группировка позволяет отслеживать достижения целей и подцелей проекта и оценивать возможный риск его выхода за установленные ограничения. Кроме того, процессы проекта группируются по категориям на процессы, связанные с управлением проектом и продуктом проекта.
Процессы управления проектом группируются по их направленности, например, процессы, связанные со сроками, включаются в одну группу. Практически во всех проектах присутствуют группы процессов установления целей проекта, управления взаимосвязями процессов в проекте, сроками, затратами, ресурсами, кадрами, информационными потоками, менеджментом рисков. Структура всех процессов проекта связана с конфигурацией ИС таким образом, чтобы в любой момент осуществления проекта была возможность реализовать требования, предъявляемые к ИС на различных стадиях ее жизненного цикла. Она определяет отношения между видами деятельности, непосредственно касающимися процессов проекта и характеристиками создаваемой ИС. ИС на каждом этапе ее построения обладает определенной базовой для данного этапа конфигурацией. Соответственно, и процессы проекта должны быть выстроены таким образом, чтобы в результате их осуществления была достигнута именно эта конфигурация.
Управление конфигурацией ИС и процессами проекта позволяет координировать управление перечисленными видами деятельности, исходя из тех изменений, которые постоянно возникают в ходе реализации проекта.
Очевидно, что чем сложнее проект, тем сильнее проявляется взаимосвязь проектных рисков и, следовательно, тем более формализованным должно быть управление проектами для адекватного снижения этих рисков. В крупных проектах работы обладают высокой связностью, поэтому любые изменения в одном процессе так или иначе влияют на другие процессы проекта.
Настоящая процедура применятся для управления рисками на проекте внедрения ИС. По согласованию сторон процедура может изменяться. Управление рисками выполняется на протяжении всего проекта с использованием журнала регистрации (реестра)рисков.
Запись риска
Таблица 9.11. Пример формы регистрации риска
|
Запрос на регистрацию риска Номер в журнале рисков:< Заполняется в ГУПР> |
||||||||||
|
< Заполняется автором запроса> ФИО автора :<Петров Петр Петрович> Роль :<Руководитель группы финансы> Проект : <ВМС 2> Фаза проекта :<Планирование> |
<Заполняется автором запроса> Приоритет :<Критично, высокий, средний, низкий (*)> Дата запроса :<дд.мм.гпт> Желаемая дата разрешения :<дц.мм.птг> |
|||||||||
|
Risk description : risk , reference point (date) of the occurrence of a risk event> risk > The expiration date of the risk : (**) Prerequisites : Consequences: Solution options :
|
||||||||||
|
PMU> |
||||||||||
|
Status (***): |
date |
Comment to status : |
||||||||
|
|
|
|
||||||||
|
|
|
|
||||||||
|
|
|
|
||||||||
|
|
|
|
||||||||
|
Results of risk analysis (****): |
||||||||||
|
Probability |
Influence |
Degree of threat |
Work strategy |
|||||||
|
100% |
Strong |
Critical |
To avoid |
|||||||
|
75% |
|
The average |
|
High |
|
To accept |
||||
|
50% |
Weak |
Average |
To reduce |
|
||||||
|
25% |
Low |
|||||||||
|
a risk-taking strategy)>
Responsible for risk: |
||||||||||
|
Approved solution to minimize risk : |
||||||||||
|
Assigned actions |
Responsible |
Term |
Action source |
Status |
||||||
|
|
|
|
|
<(*****)> |
||||||
Information is recorded in the risk registration form (see table. 9.11), consisting of:
1. Header with:
2. formulations of the current state (changes as necessary):
3. study / minimize risk:
4. solutions:
5. statements:
The risk response must be given no later than five business days from the date the question is filed. If the issue is not resolved at the level of project managers, it will be escalated to the level of the project office of the ERP implementation program.
The purpose of the risk identification process is to identify potential risks that can affect the success of the project. Risk identification is performed by project team members and risk management experts, and customers, project participants, and experts in certain areas can participate. This is an iterative process, because as the project progresses, new risks may be discovered as part of its life cycle. The frequency of iteration and the composition of the participants in each cycle can be different in each case. Members of the project team should be involved in the identification process so that they develop a sense of ownership and responsibility for risks and actions to respond to them.
Risk identification is carried out on the basis of previously developed plans for managing integration, content, terms, quality and human resources.
Also, when developing a plan, experience in implementing similar projects is taken into account.
Qualitative risk analysis involves assessing risks in terms of their possible consequences, using established criteria. Criteria can take into account costs, official and prescribed requirements, socio-economic aspects and environmental factors, the interests of the customer, priorities and other input data for evaluation. The result of the qualitative assessment process is to determine the gradation of risks according to their likelihood and consequences.
The main problem of risk management is the size of the list of risks obtained at the identification stage. It is impossible to manage all the identified risks, since it requires large financial and personnel costs. The main tasks of qualitative analysis are to divide the risks into groups and arrange them in order of priority. Risks can be classified, for example, by their time proximity. So close risks should have a higher priority than risks that may occur in the distant future. Arrangements of risks according to their importance for further analysis or planning of response to risks can be performed by assessing the likelihood of their occurrence and impact on the project. Qualitative risk analysis - a quick and inexpensive way to set priorities - is performed throughout the entire life cycle of a project and should reflect all changes related to project risks.
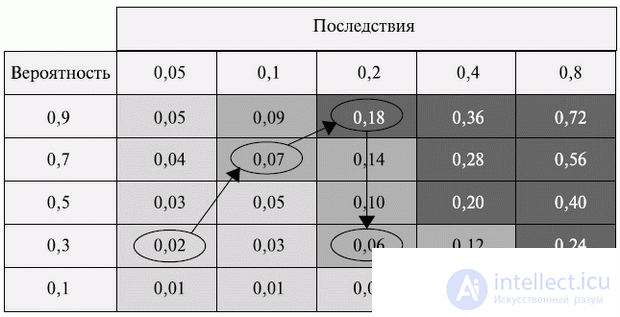
Fig. 9.2. Displays risk migration A in a risk exposure matrix
The matrix of probabilities and consequences is a tool that allows you to determine the rank of a risk separately for each goal, for example, for cost, time or content. Risk rank helps manage risk response. For example, for risks located in the high risk zone (area of the red color) of the matrix, preventive operations and an aggressive response strategy are needed (Fig. 9.2). For threats located in the low risk zone (green), preventive operations may not be required.
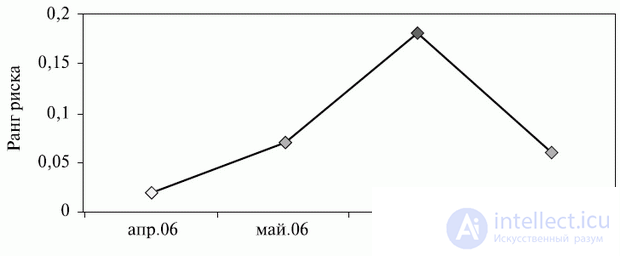
Fig. 9.3. An example of tracking the temporal dynamics of risk rank A
The matrix of probabilities and consequences allows you to track the dynamic migration of risks . In fig. 9.3 shows the change in the rank of risk A over time. In April, the risk was in the low risk zone, in May it moved to the moderate area, and in June it fell into the zone of critically high risk (see Fig. 9.3).
A quantitative risk analysis is usually performed for risks that have been qualified as a result of a qualitative analysis. A quantitative analysis also assesses the likelihood of occurrence of risks and the extent of damage / benefit; Here risks with high and moderate ranks are analyzed. The choice of analysis methods is determined for each project and depends on the availability of time and budget.
The initial information for quantitative risk analysis are:
The most common method of quantitative analysis is decision tree analysis .
A decision tree is a graphical tool for analyzing project situations that are affected by risk. The decision tree describes the situation under consideration, taking into account each of the available options and a possible scenario. The decision tree has five elements (fig. 9.4).
Decision points are points in time when alternatives are selected.
The point of a random event (the point of occurrence of consequences) is the point in time when a random event occurs with one or another result.
Branches are lines connecting decision points with random event points. The branches emanating from the decision point show possible solutions, and the lines emanating from the nodes of random events represent the possible results of a random event.
Probabilities - numerical values located on the branches of a tree and denoting the likelihood of these events. The sum of the probabilities at each decision point is 1.
The expected value (consequences) is the quantitative expression of each alternative located at the end of the branch.

Fig. 9.4. Decision Tree for a Project Situation Affected
The model is created from left to right. The construction begins with the display of the decision point, which has the form of a square. From this point draw a number of branches, equal to the number of design alternative solutions. At the end of each branch, a circle is drawn to indicate the occurrence of an admissible random event from which two branches emerge - possible results of a probabilistic event. Tree branches originate at the decision point and grow to the final results. The path along the branches of a tree consists of a sequence of individual decisions and random events.
Solution Tree Example
Table 9.12. Comparing risk response strategies
|
Risk classification |
Risk aversion |
Risk transfer |
Risk taking |
Reducing the likelihood of risk |
|
|
Risks associated with the scale of the project |
Dividing a project into several sub-projects. Reducing the functional and geographical scope of the project |
Dividing a project into several sub-projects, highlighting a pilot project by subsystems (limited scale) |
Increase the complexity of the work and the cost of the project |
Detailed analysis of each stage of work, interaction of participants, organization of work |
A detailed quality program, a well-developed project configuration management, special procedures for the interaction of participants |
|
Risks associated with insufficient IT experience |
Realization only of the non-technological part of the project, transfer of the technological part of the project to another company |
Coordination with the customer of most project documents, coordination of all changes in the functionality of the system |
Increase the complexity of the work and the cost of the project |
Conduct user training, including management, technology compliance |
Development and approval of the project concept at the earliest possible stage |
|
Technical risks of the project |
Use more reliable |
Documented |
The increase in labor-intensive |
Strict selection of project team for |
The use of standards is |
|
technological solutions |
personal responsibility of the project participants, documenting all changes in the project process |
the scope of work and the cost of the project |
qualification criteria. Training project participants technology design work tools |
project design work |
|
|
Project organizational risks |
Significant reduction of the project scope and its transformation into a purely infrastructure technological project |
Inclusion of customer representatives in working groups |
Increase the complexity of the work and the cost of the project |
Training of project participants (course "project management"), team training, the most complete formalization of activities |
Inclusion in the project administrator team, detailed distribution of roles in the project |
|
Project operational risks |
Changing the model of payment to the executing company: transfer to payment based on the result of quality assessment of the implemented solution |
The act of delivery of any document to the customer. Fixing the absence of customer claims at each stage of work |
Increase the complexity of the work and the cost of the project |
Repeated testing of the created products, thorough examination of documents |
Strict implementation of quality program procedures |
Trading company opens a new store, which should be equipped with the latest equipment. The equipment is produced by two competing suppliers (P1 and P2), who have announced the same date when the new equipment appeared on the market. To increase the efficiency of the company plans to implement the introduction of ERP class IC. Three variants of the timetable for the implementation of the information system have been developed: option 1, option 2, option 3. The project duration is considered as a parameter of paramount importance. Schedule of IP implementation depends on the supply and installation of equipment. The project team has estimated the likelihood that supplier 1 (P1) or supplier 2 (P2) will deliver the necessary equipment first. Analysis of information on previous developments of suppliers suggested that supplier 1 will put on the market new equipment with a probability of 60%; accordingly, for supplier 2, this probability will be equal to 40%.
The project team developed network schedules for three alternative schedules for the implementation of IP, provided that the equipment has already been delivered, and estimated the possible duration of the project.
Calculate the possible duration of the project for each point of a random event:
1. the expected duration for a random node A: (80 days * 0.6) + (70 days * 0.4) = 76 days;
2. Expected duration for random site B: (70 days * 0.6) + (75 days * 0.4) = 72 days;
3. Expected duration for a random node B: (75 days * 0.6) + (80 days * 0.4) = 77 days
The result of the decision tree is a variant of the schedule with the shortest duration of 72 days.
Decision tree - a tool that allows you to visually analyze the design decisions that contain several solutions. Such a definition of this method makes it possible with good reason to use it for making decisions about the continuation and development of the project at the gateways.
Based on the results of the qualitative and quantitative risk analysis, it is necessary to develop a clear understanding of the strategies used to respond to each project risk.
Risk response strategy - a set of methods that will be used to reduce the negative consequences or the likelihood of the identified risks. For each risk, you must choose your strategy that will ensure the most effective work with him.
There are four typical strategies for responding to the emergence of negative risks: evasion, transfer, acceptance and decline.
1. Avoiding risk
The strategy is to completely eliminate the impact of risk on a project by changing the nature of the project or project management plan . Some of the risks that arise in the early stages of a project, for example, due to the lack of a clear definition of customer requirements, can be avoided by spending additional time and increasing labor costs for their identification. However, this strategy cannot completely eliminate the risk.
2. Transfer of risk
A risk transfer strategy also eliminates the risk of risk by transferring the negative effects of risk with responsibility for responding to risk to a third party. The transfer of risk is usually accompanied by the payment of the risk premium to the party taking the risk and responsibility for its management. The risk itself is not eliminated. Conditions for transferring responsibility for certain risks to a third party may be specified in the contract.
3. Acceptance of risk
Strategy means a team decision not to shy away from risk. When passively accepting risk, the team does nothing about the risk and, if it does occur, develops a way to circumvent it or correct the consequences. With active risk taking, a plan of action is developed before the risk can occur, and is called a contingency plan.
4. Reducing risk
A risk reduction strategy involves an effort to reduce the likelihood and / or consequences of a risk to acceptable limits. The reduction strategy uses the inclusion of additional work in the project plan, which will be performed regardless of the risk, such as conducting additional testing of the information system functionality, developing a prototype system, and additional involvement of experienced employees in the work.
The content validation process formalizes the acceptance of the completed project delivery results. Confirmation of the content is the formal acceptance by the project participants of the completed project content and related delivery results. The process of confirming the content of the project includes checking the availability of all the works that ensure the results of the delivery. If the project is terminated ahead of time, the content validation process should establish and document the level and extent of its implementation.
The input to the process is:
Confirmation of the content is performed by an inspection method that includes operations such as measuring, studying and checking, and serves to determine whether the work meets the delivery results, requirements and criteria for product acceptance.
The content validation process documents the deliverables that have been accepted in accordance with the project acceptance procedure. Missed deliverables are documented with reasons why they did not pass acceptance. Confirmation of the content includes accompanying documentation received from the customer or sponsor and confirming the fact of acceptance of the results of the delivery by project participants.

Comments
To leave a comment
software project management
Terms: software project management