Lecture
This process is designed to provide control over revised cost estimates, budget updates, and forecasting of the final cost of the entire project. During this process, the main supporting tools will be: the basic cost plan and information on the execution of the project plan, as well as co-supporting and specific processes and procedures.
One of the key and most well-known methods (however, with a low degree of distribution in projects) is the EVA (Earned Value Analysis) method, which provides for the periodic recording of past project states to predict the future. During the evaluation of the project status, the progress of the schedule and the cost of the project is measured in order to find out if the project is behind or ahead of the schedule (deviations in terms of time and cost) and why this happens. Then forecasting the final cost of the project and the date of completion. The elegance of this method lies in the ability of EVA to combine the content, cost, and schedule of a project and proactively predict the total cost of project completion. Such predictions create opportunities for the timely solution and retention of the project within the established deadlines and costs [18].
From the point of view of application, EVA is the right choice for any project, regardless of the subject area and size. In the presence of such resources that large projects possess, the use of full-scale EVA seems to be quite reasonable.
Nevertheless, it is worth paying special attention to the fact that any project that needs EVA must establish content, perform resource budgeting and schedule tasks. When all this is done, small projects can be considered ready for simple versions of EVA.
Application of the method of mastered volume
In order for EVA to be effective, it must rely on the following reliable and correctly prepared information:
These elements are of critical importance for the reason that if, for example, the assessment says that 20% of the work has been performed and the content of the work is not fully determined, then the accuracy of such an assessment is low, because this assessment is based on the not completely defined content of the work. An orderly and adequate application of the SRI (see relevant section) can help in obtaining a correct idea of the fully-defined content of the project.
If there is a basic schedule, each task will be accurately described in terms of its beginning and completion, as well as the duration. This information, together with the approved base plan, at a cost, determines the time and cost of the work. As the project is deployed, the actual work performed is estimated and the total project volume is determined.
Summarizing the step of collecting information, we can say that EVA requires a fully defined project content, integrated with the basic schedule and project cost plan, which will accurately characterize the project progress relative to the plan (s).
Key values that are operated within the framework of this method:
The project management components (see below for collecting information for this method) are not required, however, in Fig. 17.1 presents a simple way to understand the meaning of each of the key values of a method.

Fig. 17.1. Key values of the method of mastered volume (EVA)
Next, you need to determine how often data will be collected to assess the progress of the project. Too frequent analysis can be costly, and with a low frequency there is a risk that it is too late to identify a negative deviation of the project both in terms of cost and time. It is recommended to reflect the frequency of collecting actual information on the project performance in accordance with the so-called basic measurement plan of the project implementation (PMV - PerformanceMeasurement Baseline). The process of deploying this plan includes identifying management control points (management control), people responsible for them, and choosing a method to measure cost performance [18].
The basis for accomplishing these tasks is the basic project plan, which fully defines the project content, integrating it with the resource plan and transforming them into a schedule to be executed; All this is done within the framework provided by the SRI. Taking into account the fact that the SRI has elements at different levels, you need to decide which elements (at what level) will be management control points - the points at which we measure and monitor the progress of the project.
There are several ways to distribute management control points according to the basic project schedule and principles for the subsequent assessment of the project progress. When making a choice of method, the project team and managers should focus their attention on the ease and accuracy of measurements - use them consistently (logically consistently) to adequately support the needs of the project. Below are the two most common methods [18].
Formula 5. Calculation of key indicators of the EVA method
CV (cost variance ) - deviation of cost | CV = EV - AC |
SV (schedule variance ) - deviation by dates | SV = EV - PV |
CPI (cost performance index) - budget performance index | CPI = EV / AC |
SPI (schedule performance index) - schedule execution index | SPI = EV / PV |
EAC (estimated at completion) - cost forecast at project completion | EAC = BAC / CPI |
1. Deviation of cost (CV - cost variance ). The absolute indicator that describes how much more / less we spent compared to how much we should have spent on the implementation of completed tasks.
2. Deviation in terms (SV - schedule variance ). An absolute indicator characterizing how much more / less we have done compared to the volume of tasks planned for the current date in the basic project schedule .
3. Budget performance index ( CPI - cost performance index). A relative indicator characterizing how much more / less we spent compared to how much we should have spent on the implementation of completed tasks. It is used to compare different projects with each other.
4. Schedule execution schedule (SPI - schedule performance index). A relative indicator characterizing how much more / less we have done compared with the volume of tasks planned for the current date in the basic project schedule . It is used to compare different projects with each other.
5. Cost forecast at the completion of the project (EAC - estimate at completion). Estimated total project costs, subject to the current cost variance characterizing CPI . After calculating the key indicators, the results are interpreted (see Fig. 17.2) and, depending on the procedures adopted, the implementation of corrective measures (overruns and / or backwardness) or fixation of the result (savings and / or advance).
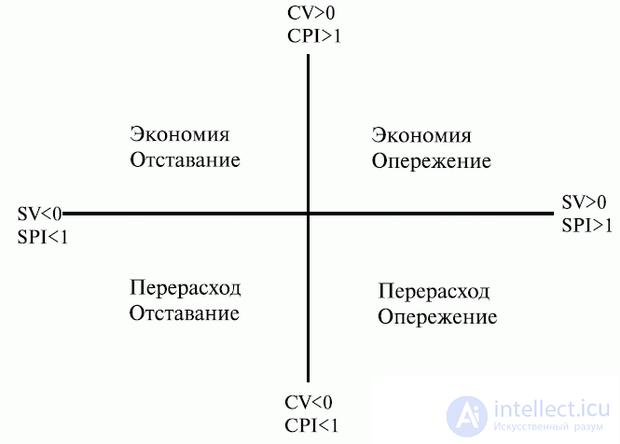
Fig. 17.2. Interpretation of EVA indicators
An example of an EVA-based project cost management procedure
1. The project estimate is developed by the project manager on the part of the contractor at the stage of creating a description of the project content, according to the cost categories specified in the template, and determining the amount of management reserve and reserve provided for unforeseen circumstances.
2. The project budget is developed by the project manager from the contractor on the basis of a detailed schedule, information on the cost of the resources involved: human (consultants) and material (equipment, licenses).
3. Overhead costs are distributed over the corresponding phases in the ratio of 50% at the beginning of the phase and 50% of the results of the phase. Overhead costs related to the entire project (equipment of the project office) are attached to the first stage of the project in accordance with the above rule.
4. The baseline cost plan is developed by the project managers for the next phase, taking into account the data on the completed and current phases.
5. At the end of each reporting period, functional areas managers form a report on the project status, updates to the project plan, and a report on resource costs for the entire project up to the current date and for the current reporting period. The prepared reports are sent to the project administrator 1 day before the next reporting project meeting.
6. The project administrator is responsible for collecting all the information about the costs of resources for the reporting period from the heads of functional areas. Within one day, he makes entering the received data into a single chart of the calendar-value tracking of the project. The updated chart of cost-based tracking and the value of the actual cost of the project on the current date are sent to the project managers.
7. Project managers receive data on the actual cost of the project and an updated chart of cost planning. Within 0.5 days, the project manager on the customer’s side compares the value of the cost planning chart with the basic cost plan and the basic plan for managing the schedule of the project. The project manager on the part of the customer calculates the key values of the used volume (EV, PV, AC) and coefficients (CV, SV, EAC), enters the values into the register of the used volume and informs the project manager on the part of the contractor;
8. If the CV or SV value shows a deviation in the same direction by more than 10% during 3 reporting periods, the project managers at the reporting meeting inform the project sponsor and the project governing body.
9. If it is necessary to adjust the budget and base plan at the cost of the current project phase, the project managers, on the recommendation of the project sponsor, decide to amend the budget and base plan at the cost of the current project phase in accordance with the change management procedure, see the Integrated Change Management procedure. ".
10. The decision on the use of reserve for unforeseen circumstances is made by the project sponsor.
11. The decision on the use of management reserve is made by the governing body of the project.
12. The chart of the calendar and cost tracking of a project is reflected in the project management information system. The register of mastered volume is maintained in MS Excel spreadsheets.
At the stage of control of each stage of the life cycle IT, monitoring , control and reporting on the relevant stage of the project are carried out.
The objectives of the stage are [22]:
Background information for the implementation of control actions are project strategies, standards and procedures. The main tasks of the stage are review of results, audit of processes, control of performance of quality indicators. The key result is the documented results of the project audit.
The quality review consists in analyzing the project results for compliance with the standards and requirements of the project. When developing a quality management plan (at the planning stage), quality reviews are prepared regularly during project implementation and are accompanied by relevant comments to the review. Quality reviews can be prepared with or without the participation of the customer only by the project team.
A quality audit is carried out with the aim of assessing the progress of the project in compliance with the project plans, accepted standards and procedures. The purpose of the audit is to confirm that the approved procedures are being implemented and meet the requirements of the project. According to the results of the audit report is compiled.
The methods used for quality control include end-to-end control, inspections, testing, reviews of the results. The quality control at the design stage can be performed using the inspection method.
Table 17.1. Sample Test Script Summary Form
No | Script Name | Script Description | Date Time | Tester | Receiver | Success (yes / no) | Notes |
. | |||||||
Comment to the form 1. No : The script number of the test business process. 2. Scenario name : Short name of the business process testing scenario. 3. Scenario description : A description of the scenario of testing a business process. 4. Date, time : Date and time of the test. 5. Tester : Consultant from the performer involved in testing. 6. Acceptor : Employee functional group from the customer involved in testing. 7. Success? (yes / no) : A mark about the success of the test script. 8. Notes : Additional explanations to the results of the scenario. | |||||||
Inspection includes processes such as testing undertaken to determine whether the project’s results conform to accepted requirements and standards. Distinguish testing of individual business processes and their combination (integration testing). For testing develop scenarios. To implement the quality control of the developed IS, a summary scenario table is compiled. An example of the form of such a table is given in table. 17.1.
Errors detected during testing are recorded in a special journal. An example of the form of the error log is presented in Table. 17.2.
Quality control is provided by the project manager, quality manager, project team. In tab. 17.3 the functions of the participants in the control process are collected [22].
The purpose of monitoring is to monitor the progress of the implementation of the adopted plans (risk prevention and mitigation), the quantitative parameters, the conditions determining the application of the risk response plan, and to inform the team in the event of a risk.
Risk monitoring is performed using the following methods.
1. Risk revision
Table 17.2. Error log form example
Script name | Test step number | Process step | Module | Error description | Decision | Responsible | Intent date |
. | |||||||
. | |||||||
. | |||||||
Comment to the form "Error log" 1. Script name : Short name of the business process test script. 2. Test Step No .: A unique test step identifier in the ZP # .NN format, where Z is the test script number, P # is the 5-digit process number and NN is the unique 2-digit code within the script. 3. Process step : The number and name of the test step of the business process. Business process step number in the P # .NN format, where Р # is a 5-digit process number, and NN is a unique 2-digit code within the process. 4. Module : The IP module using which the business process step is implemented. 5. Error description : a detailed description of the error detected during the test, with a link to the file containing complete error information. 6. Solution : Planned measures to eliminate the error. 7. Responsible : The employee designated as responsible for eliminating the error in the scheduled time. 8. Target Date : Planned Deadline for Elimination of Error | |||||||
In the design phase, it is launched for the first time after identifying risks in the planning phase.This method should be used regularly, according to the schedule drawn up at the planning stage. In the process of monitoring and managing risks, it may be necessary to identify new risks, review the status of known risks and plan additional risk response measures. In particular, practice shows that among the most likely areas of risk in the design phase are the following:
Table 17.3. Functions of the project team members to ensure the implementation of the monitoring process
Function The result of the function | |
Project Manager | |
Organization of the review of the project results and coordination of the revealed comments | Quality review (review process results) |
Organization of the audit of the quality of work and coordination of the identified comments | Quality audit (results of the audit process) |
Organization of work on the collection of information on the performance of work | Quality indicators (results of the quality indicators monitoring process) |
Quality manager | |
Analysis and coordination of the identified results | Quality review (review process results) |
Analysis and approval of audit results | Quality audit (results of the audit process) |
Quality Score Analysis | Quality indicators (results of the quality indicators monitoring process) |
The project team | |
Participation in project results reviews | Quality review (review process results) |
Participation in the audit of the quality of work, the implementation of agreed activities | Quality audit (results of the audit process) |
Participation in the collection of information on the quality of work. | Quality indicators (results of the quality indicators monitoring process) |
2. Аудит рисков
Предполагает анализ и документирование результатов оценки эффективности мероприятий по реагированию на риски, изучение причин их возникновения, оценку эффективности процесса управления рисками.
Таблица 17.4. Пример формы (интенсивного) мониторинга сотрудника
Тип риска | Описание риска | Проактивные мероприятия | Реактивные мероприятия | Пороговые состояния | Probability | Влияние | Фактор риска |
Политический | Заказчик решил не внедрять систему | Плана нивелирования риска не существует. Заказчик решает либо внедрять систему, либо не внедрять | Если заказчик не представляет стратегической ценности для компании-исполнителя - не начинать проект | 6 | 9 | 54 | |
Политический | Ввиду того, что выбор системы (и подрядчика) проводился холдинговым руководством заказчика, сам заказчик на текущий момент не заинтересован в проекте и внедрении системы | 9. . Проведение ряда заблаговременных семинаров, повышающих уровень заинтересованности заказчика во внедрении системы. 10. Организация референс-визи-тов к успешным клиентам. 11. Определение реальных лидеров в организации. Точечное повышение уровня их заинтересованности в успешном внедрении системы 12. ... | п/а | eight | four | 32 | |
. | 0 | ||||||
3.Анализ отклонений и трендов
Тренды в процессе выполнения проекта подлежат проверке с использованием данных о выполнении. Для мониторинга выполнения всего проекта применяют методику освоенного объема. Отклонения от базового плана могут указывать на вызванные рисками последствия.
4.Анализ резервов
При анализе резервов производится сравнение объема оставшихся резервов на непредвиденные обстоятельства с количеством оставшихся рисков.
5.Совещания по текущему состоянию
Периодические совещания команды проекта по вопросам управления рисками являются инструментом для отслеживания состояния рисков проекта.
Процесс мониторинга сопровождается обновлением журнала управления рисками, шаблон которого приводился в одном из предыдущих разделов.
Управление рисками на фазе проектирования производится аналогично управлению на предыдущей стадии.
Во время мониторинга команда проекта выполняет планы по предотвращению рисков. За прогрессом этой деятельности ведется наблюдение. Отслеживаются изменения значений триггеров рисков. Для удобства выполнения мониторинга применяют специальную форму [11], пример которой приведен в таблице 65.

Comments
To leave a comment
software project management
Terms: software project management