Lecture
2.2. Key indicators of durability
2.2.1. Average life (expectation of life)
For a restored object, the average service life is the average calendar duration of operation of the object from its beginning or its renewal after repair of a certain type to the transition to the limiting state.
2.2.2. Average Resource (Expectation Resource)
The average resource is the average operating time of the object from the start of operation or its renewal after the preventive repair to the onset of the limit state. In operation, it is very important to choose the parameters of the facility for power, maintenance and repair strategies, operating modes, so that the service life and the service life of the resource coincide. Operating experience of mass production facilities (transformers, switches, disconnectors, circuit breakers, etc.) shows that both time between failures and time between failures have significant statistical variation. The resource and service life also have a similar spread. This variation depends on the technological culture and discipline, as well as the achieved level of technology, both the production of objects and their operation (use as intended, maintenance, repair). The spread of operating time to the first failure, resource and service life can be reduced by increasing their value in the above ways.
Since the average and capital repairs allow the resource to be partially or fully restored, then the countdown of life time when calculating the resource is resumed after such repair is completed, distinguishing in this connection the pre-repair, overhaul, post-repair and full (before decommissioning) resource. The term “technical resource”, which occurs quite often, is a stock of possible object life. The full resource is counted from the start of operation of the object to its transition to the limit state corresponding to the final cessation of operation.
Similarly, there are types of life. The ratio of resource values and service life depends on the intensity of use of the object. Full service life, as a rule, includes the duration of all types of repair, that is, the calendar period is taken into account.
For a non-recoverable object, the resource is the average duration of work until failure or before the onset of the limit state. In practice, this value coincides with the mean time to failure T 1 .
Also used is a measure of durability, as a gamma-percentage resource, representing the operating time during which the object does not reach the limit state with a given probability (numerically equal to a given value of g in percent).
2.3. Main indicators of maintainability
In the quantitative description of this property, which is inherent only in the object being restored, the recovery time is a random variable depending on a number of factors: the nature of the failure that occurred; the fitness of the object (device, installation, etc.) for the rapid detection of failure; staff qualifications; availability of technical equipment; quick replacement of the failed element in the object, etc. The recovery time is the time spent on detection, finding the cause of the failure and eliminating the consequences of the failure. Experience shows that in complex electrical installations (systems) 70-90% of the recovery time falls on the search for a failed element [2, 15, 16, 17].
2.3.1. Average recovery time
The average recovery time is the mathematical expectation of the recovery time of an object’s operational state after a failure. From the definition it follows that
 , (2.17)
where n is the number of restorations equal to the number of failures;  - time spent on recovery (detection, search for the cause and elimination of failure), in hours.
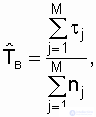
Indicator  can be determined on the basis of statistical data obtained for M of the same type of restored objects. The structure of the calculation formula remains the same:
 (2.18)
where M is the number of objects of the same type, for each of which the total recovery time is determined  for a given observation time;
 where
where  - recovery time of the j-th object after the i-th failure; nj - the number of restorations of the j-th object during the observation, and
  .
.
2.3.2. Recovery intensity
The recovery intensity is the ratio of the conditional probability density for restoring the operational state of an object, determined for the point in time under the condition that, until this point, the recovery has not been completed, to the duration of this interval.
Statistical evaluation of this indicator is as
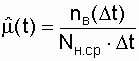 , (2.19)
where n in ( D t) is the number of restorations of similar objects for the interval D t;  - the average number of objects in the unrestored state on the interval D t.
In the particular case when the recovery intensity is constant, that is, m (t) = m = const, the recovery probability for a given time t obeys the exponential law [3, 13, 21] and is determined by the expression
 . (2.20)
This particular case has the greatest practical significance, since the real law of distribution of the recovery time of most power facilities (restoration flow) is close to exponential [10, 14]. Using the properties of this distribution, we write a very important dependency:
 , and
, and  . (2.21)
In the future, this relationship between T in and m will often be used in the analysis of recoverable systems.
With more detailed calculations of the reliability indicators of the repaired (restored) objects, such maintainability index is determined as the percentage recovery time g . This is the time during which the recovery of the object will be carried out with a probability g , expressed as a percentage [7].
2.4. Comprehensive reliability indicators
2.4.1. Availability factor
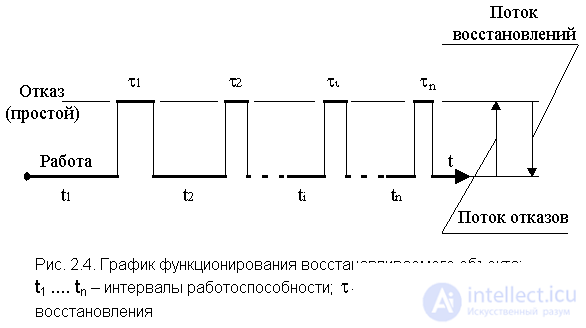
The process of functioning of the restored object can be represented as a sequence of alternating intervals of health and recovery (idle).
The availability factor is the probability that the object will be in working condition at an arbitrary point in time, except for planned periods during which the use of the facility for its intended purpose is not foreseen [7]. The mathematical definition of this indicator is given below (Section 7) when analyzing the reliability of recoverable systems.
This indicator simultaneously assesses the properties of health and maintainability of the object.
For one repaired object availability factor
 (2.22);
 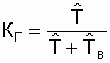 , K Gmax = 1 . (2.23)
From the expression 2.23 it can be seen that the object availability factor can be increased by increasing the time between failures and reducing the average recovery time. To determine the availability factor, a sufficiently long calendar period of the facility operation is required.
The dependence of the availability factor on the recovery time makes it difficult to assess the reliability of the object, since it is impossible to judge the time of continuous operation to failure by K G. For example, for the same numerical value of KG it is possible to have small intervals  and t i (see fig. 2.4) and much larger. Thus, it is possible to prove that at a specific interval of uptime, the probability of failure-free operation will be greater where t i is greater, although a long interval of inactivity may follow this interval. . Availability is a convenient feature for objects that are designed for long-term operation, and solve the problem in a short period of time (are in standby mode), for example, relay protection, contact network (especially with relatively small size of movement), complex control equipment and etc.
2.4.2. Operational readiness ratio
The coefficient of operational readiness for the exhaust gas is defined as the probability that the object will be in working condition at an arbitrary point in time (except for planned periods during which the use of the object for its intended purpose is not foreseen) and, from this moment on, will work smoothly during a given time .
From the probabilistic determination it follows that
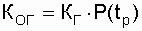 , (2.23)
where K G - availability factor; P (t p ) is the probability of an object failing to work during the time (t p ) necessary for a trouble-free use as intended.
For often used in the calculation practice of the simplest flow of failures, when
l = w , P (t p ), respectively, is determined by the expression
 .
.
2.4.3. Coefficient of technical use
The coefficient of technical use K TI is equal to the ratio of the mathematical expectation of the total time the object is in working condition for a certain period of operation to the mathematical expectation of the total time the object is in working condition and downtime due to maintenance and repair for the same period of operation:
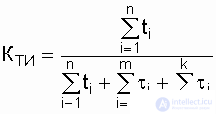 , (2.25)
where t i - the time of preservation of health in the i-th cycle of the functioning of the object;  - recovery time (repair) after the i-th object failure;
  - the duration of the j-th prevention, requiring the withdrawal of the object from the operating state (use as intended); n is the number of operating cycles for the considered period of operation; m is the number of failures (recoveries) for the period under consideration; k - the number of preventive measures that require disabling the object in the period under consideration.
As can be seen from the expression (2.25), the coefficient of technical use characterizes the fraction of the time the object is in working condition relative to the total (calendar) duration of operation. Consequently, K TI differs from K G in that when it is determined, all the time of forced downtime is taken into account, whereas in the definition of K G the idle time associated with carrying out preventive work is not taken into account.
The total downtime of an object usually includes the time:
- to search and eliminate failure;
- to adjust and configure the object after the elimination of failure;
- for downtime due to lack of spare parts;
- for preventive maintenance.
In electric power facilities, for example, in transformers, power lines, buses, switchgears, etc., planned shutdowns are provided for scheduled repairs and maintenance. These time intervals as well as the intervals associated with the outage due to failure, are taken into account when determining the analyzed safety factors.Under operating conditions, maintenance and repair have a great influence on the level of reliability of facilities. Details of the maintenance and repair, the strategies of their organization and their decisive impact on reliability are discussed in [1, 16].
GOST 27.002-89 contains, in addition to those analyzed in
this manual is the most commonly used *** reliability indicators and other indicators: average recovery labor intensity, average shelf life, gamma percentage resource, gamma percentage recovery time, gamma percentage shelf life, etc. If necessary, specific indicators are used to determine these indicators, where the calculation procedure is based on the same laws of mathematical statistics and probability theory, which are used to determine the more widely used indicators of reliability.

Comments
To leave a comment
Theory of Reliability
Terms: Theory of Reliability