Lecture
There are two ways to calculate the reliability indicators of non-repairable objects based on the data on failures:
1) the calculation of the experimental distribution of time to failure;
2) the calculation of the parameters of the theoretical distribution of time to failure.
As theoretical distributions of time to failure, any continuous distributions used in probability theory can be used.
From the theory of reliability it is known that the random time of the occurrence of failures can be described by the mathematical laws of the distribution of random variables, which just makes the science of reliability strict.
The basis of engineering methods for calculating reliability, taking into account sudden failures, is the exponential distribution law, and in calculation methods that take into account the influence of parametric failures is a normal law.
A number of considerations can be made in favor of the application of the simplest distribution laws. First, for a number of components and systems, these laws are statistically confirmed. In addition, many types of distribution with an increase in the number of components or an increase in the time of testing equipment asymptotically tend to the simplest laws. Finally, probabilistic indicators are most often used for a comparative assessment of the reliability of the designed systems, and the involvement of simple models in engineering calculations is most justified.
 If we accept that the structural reliability of objects is mainly determined by catastrophic failures, then it is natural to assume that the failure rate will fall, as shown in Figure 4, but due to the elimination of defective elements and poor-quality assembly sites.
Parametric failures characterize the reliability of structural and operational performance of objects, which causes an increase in the intensity of parametric failures (Fig. 4. b) as the deregulation of the equipment and wear of its parts occur under the influence of external conditions and internal destabilizing factors.
We assume that the failures of both groups are independent of each other. Then the overall reliability of the object will be p (t) = p n * p nn , and the total failure rate is in the form of Fig. 1.4, c, which is very close to the picture of the development of failures in a really functioning equipment.
That is why the study of the reliability of a wide variety of objects refers to a small circle of known distributions.
1. Poisson distribution. Characterizes the appearance of rare events. The probability of the appearance of failures c during time t is expressed by the following relationship:

2. Exponential distribution. It is used more often than other distributions, since it is typical for complex objects consisting of many elements with operating time distributions. With the constancy of the failure rate gives simple calculation formulas

 Dependence between Poisson distribution
and exponential is shown in fig. 1.5.
3. Truncated normal distribution. The distribution obtained from the normal (Gaussian) restriction only positive values:
f (t) = c * f (t), where  -density of unbroken distribution; c is the normalizing factor found from the condition that the area under the distribution curve is 1.
4. Gamma distribution . The Poisson distribution and the gamma distribution are considered in interconnection, since they both characterize single processes. Only in the first case failures are considered as a variable, and in the second - time. For gamma distribution  in - the average time between failures;
a - the number of failures; G ( a ) is a gamma function equal to  when a –1 is a positive number.
 Weibul distribution.
 This is an empirical distribution, derived from a study of a wide class of service life distributions.

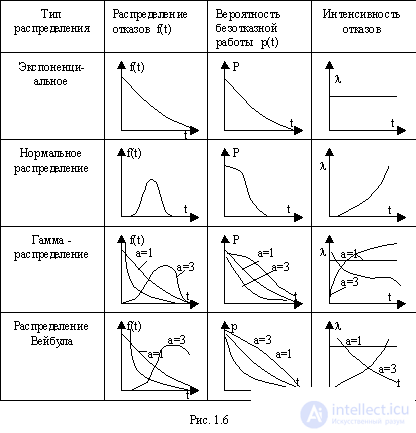
The type of curves of various distribution laws is shown in Fig.1.6.
1. What basic states of objects are distinguished in the theory of reliability, to reveal these concepts.
2. What is a failure? How can classify failures?
3. What groups of objects can be distinguished, differing in reliability indicators?
4. What are the functions of reliability and unreliability? List their basic properties.
5. What is the conditional probability of failure-free operation and the density of the distribution of operating time to failure? How do they differ from each other.
6. Expand the concept of average operating time to failure.
7. List the basic laws of the distribution of failures. Lead distribution curves.

Comments
To leave a comment
Theory of Reliability
Terms: Theory of Reliability