Lecture
8. ANALYSIS OF RELIABILITY INDICATORS ACCORDING TO THE EXPERIMENTAL DATA
In the previous sections, an assessment was made of the reliability of objects (systems), based on the fact that the initial indicators of the reliability of the elements that make up the system are known. Meanwhile, as already noted, reliability is laid in the design, is provided in the manufacture and maintained in operation. At each stage of the life cycle of an object, it is necessary to evaluate its actual reliability; this requires experimental data. In operation, personnel have passport baseline indicators of the reliability of the elements that make up the object (system). In order to assess the actual durability, reliability, maintainability and compare them with the parameters of the manufacturer, the data obtained in the operating conditions are necessary. An important source of information about reliability is the system for collecting data on the operation of objects during operation.
8.1. Documentation for the collection of primary information
In order to ensure the unity of the initial reliability data, the primary information on the failure, in accordance with the existing regulatory and technical documentation, should contain certain informational signs: the date of the occurrence of the failure or malfunction; the total operating time of the object from the beginning of its operation until the establishment of a failure (fault determination); external signs and the nature of the failure or malfunction; operating conditions and type of work under which a failure was detected or a malfunction was established; remedy; taken or recommended measures to prevent the occurrence of failures or malfunctions [3, 18]. Information gathering and filling of primary documentation on reliability are carried out under normal conditions by service personnel, and during experimental and controlled operation, either by duty personnel or by representatives of the reliability service (group), organized specifically for collecting reliability information [18].
The main types of documentation for collecting primary information on failures of system elements are magazines, forms, cards. The logs record information about the reliability of all elements of the system under control. Forms are maintained for each object (device). Their advantage is that they contain all the information about the operation of the device since its installation (for example, a power transformer). Cards are the most operational form of information. They are filled with every failure. The information reflected in the cards is best prepared for its automatic processing on a computer [3, 18, 19].
If information is collected by dedicated personnel or service personnel (groups) for this chain of reliability, control and recording of data on working conditions, the consequences of failures are made by representatives of this service. The rest of the documentation is maintained by the service personnel.
8.2. Test planning and processing of experimental data
In accordance with the requirements of GOST 27.002-83, test planning provides for a number of preconditions that ensure the effectiveness of tests. Symbols of various plans are introduced in the form of a set of three characters, the first of which indicates the number of tested objects (devices) N, the second - the presence (R) or absence (U) of replacement (restoration) of objects that failed during the tests, the third - the duration of the tests ( r or T). Thus, for testing N objects without replacing the failed ones, we have the following three plans:
(N, U, r) - tests to the r-th failure, r Ј N;
(N, U, T) - test duration T;
[N, U, (r, T)] - a test of duration equal to  or T) where
  - the moment of the r-th failure, and T - a predetermined time, or km of run, or the number of cycles, etc.
Similarly, we introduce the notation for plans with the replacement (restoration) of failed devices:
(N, R, r); (N, R, T); [N, R, (r, T)]. In terms of (N, R, r) in contrast to
(N, U, r) the number r can be greater than N (where, in particular, N = 1 is valid). Here are the 6 most common types of tests. GOST 27.001-83 provides 16 test plans, which take into account, in addition to the above conditions, such as M - restoration of objects during tests in the event of their refusals; S - the decision on the end of tests (on acceptance or rejection) of the objects being restored (based on the total test time).
The results of statistical processing of tests essentially depend on probabilistic models, that is, on a priori (theoretical) distributions of trouble-free operation intervals and restorations. These results can lead to obviously wrong conclusions if the model does not reflect the actual failure processes and recovery mechanisms. Therefore, before solving the main problems of the a posteriori (based on experience) analysis of reliability, it is advisable to first check, using the statistical acceptance criterion, that the chosen a priori distribution matches the empirical distribution based on the data from the tests performed.
The initial data (random variables) that are processed are the time between failures, the time between recovery and the number of failures of the same type. After such a material is collected, its processing allows us to establish the distribution laws of reliability indicators: the probability of failure-free operation, the failure rate, the average time between failures, etc.
Knowledge of the laws of distribution makes it possible to determine all other quantitative indicators of reliability. Thus, the main task of statistical processing is to determine one of the laws of the distribution of initial random variables. In some cases, the form of the law of distribution is known in advance, prior to experience. For example, as already noted above, for electronics of automation and relay protection means the exponential law of distribution of reliability indicators is valid. This is confirmed by numerous experimental data obtained under operating conditions [3, 11, 18, 19].
In determining or confirming the distribution law, the following procedure is advisable: the preparation of experimental data; construction of histograms of the estimated reliability index; approximation of histograms by the theoretical distribution law and determination of its parameters; checking the admissibility of the proposed law of distribution based on the use of consent criteria [3, 12, 19]. The most commonly used criterion  or Kolmogorov criterion. To obtain sufficiently accurate results, the number of observations of a random variable (failures) should be at least 40-50.
According to the results obtained during the operation of the data tables are compiled, see table. 8.1.
Note:  - time intervals from the beginning of the experiment (t = 0) to the corresponding moment;
  - the number of failures recorded for the corresponding time, starting from the beginning of the experiment; D t i - the length of time, for example
  = t 2 - t 1 ; D t i =
  - t i (as a rule, D t 1 = D t 2 = ... = D t i , that is, D t i = const);
  - the number of failures recorded for a given period of time D t i ; N о - the number of similar samples put to the test;
  - the average number of samples operable on the corresponding segment D t i ;

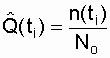
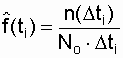
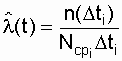
 - respectively, assessing the probability of failure, the distribution density of failures and failure rates. According to the table. 8.1 the histograms of the sought reliability index are plotted, then the histograms are approximated. According to the type of approximation of the analyzed curve, it is possible to approximately establish the law of the distribution of failure time. For the exponential law, the l (t) graph is most indicative . If the analyzed dependence turns out to be l " const (see Fig. 2.2), then this is an exponential law.
Table 8.1
Experimental data to build
distribution histograms
| t i h | ||||||
 PC PC | ||||||
 | ||||||
| D t i , h | ||||||
| , PC. | ||||||
 , 1 / h , 1 / h | ||||||
 , 1 / h , 1 / h |
According to Kolmogorov's criterion, the experimental distribution of a random variable is consistent with the selected theoretical distribution, if the condition  , in which D is the largest deviation of the theoretical curve of the distribution function of time to failure from the experimental one, and n is the number of failures. An example of histogram approximation
  , received as a result of processing of a statistical curve, is presented on fig. 8.1.
To build a theoretical curve 2, the value of l is determined from the graph  based on experimental data (Table 8.1). A similar graph is shown in Fig. 2.3. The linear part of the graph, running parallel to the time axis, corresponds to an exponential model, that is, l = const.
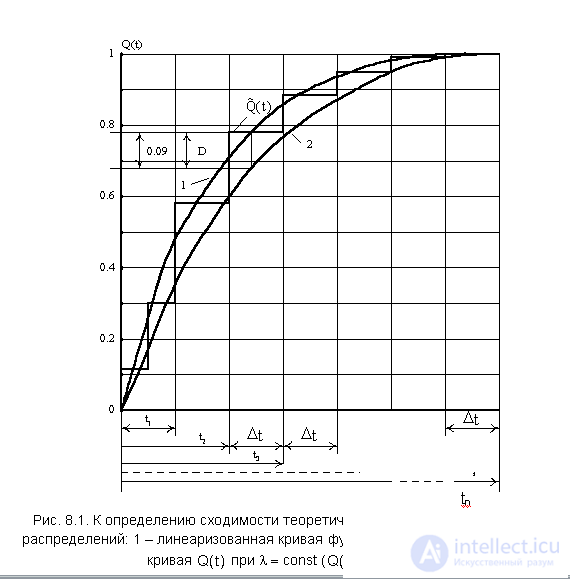
The largest deviation D is determined between curves 1 and 2. The number of detected failures n during the observation period is determined by the formula  . In order to avoid errors when plotting graphs (Fig. 8.1), they need to be built on special paper with a small millimeter grid at an appropriate scale. The value of the parameter D is determined by the simple difference of the values of curves 1 and 2 in the zone of their greatest divergence. If a
  then we can assume that the value l = const, obtained from the experimental data, is the desired parameter of the exponential distribution. The probability of failure-free operation of the analyzed type of elements, respectively, is determined by the formula
  and the mean time to failure is the formula
  .
.
Examples of compliance criteria  are stated in [11, 12, 13, 19].
8.3. Interval evaluation of reliability indicators
The amount of statistical data for assessing the reliability obtained during operation is fundamentally limited. Obtained from a limited amount of information point estimates can be very approximate. Moreover, the deviations of these estimates from the true value of the estimated parameter are random variables. Obviously, with an increase in the number of observations (failures), the random error in the evaluation of indicators decreases. Based on the experimental data, a special method is used to assess the reliability indicators in a certain range of their possible values. Assume that the true value of the mean time to failure is T 0 , and the mean time to failure is determined by the received failures:
 ,
,
where n is the number of failures during the test, t i is the time to the i-th failure. The smaller n is, the greater the difference between T 0 and  that is, there is a discrepancy interval. Find the exact boundaries, within which is the true value of the desired quantity, it is not possible. However, it is possible to determine the interval of its possible values with some confidence probability
  . In this case, the greater the confidence probability b , the wider the boundaries of the interval and vice versa. In general, this dependency has a record
 , (8.1)
where T n and T in - respectively, the lower and upper bounds of the average time to failure, where they lie and T 0 .
The probability that the value of T 0 goes beyond a given interval is called the level of significance:
 (8.2)
(8.2)
The values of confidence b are usually taken equal to 0.9; 0.95; 0.99. The corresponding significance levels will be 0.1; 0.05; 0.01. The confidence probability b , defined by expression (8.1), characterizes the degree of reliability of the two-way results (that is, the definition of the upper and lower bounds) of the estimate.
The confidence interval for the mean time to failure with equal probabilities a / 2 of going beyond the right (upper) and left (lower) boundaries for the exponential distribution [11, 19] is determined by the expression
 , (8.3)
Where  and
and  - values (chi-square) with parameters
  and 1 - ; 2r = k is the number of degrees of freedom, for probabilities P = and P = 1 - respectively.
When only the lower bound is calculated,
 . (8.4)
In expressions (8.3) and (8.4)  - total time to failure on failures recorded during the experiment. Meanings
  determined by the table P-1 distribution quantile (chi-square).
Thus, for given levels of significance a and the number of degrees of freedom k, the table (see Appendix 1) finds the corresponding values , substitute in the expression (8.3) and find T n and T in . The value of a is set depending on the requirements for the system being analyzed. As is known, for the exponential law  and
and  , and the expressions for estimating the reliability of the upper and lower values of the probability of failure-free operation are
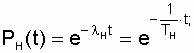 where
where 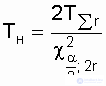 ; (8.5)
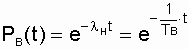 where
where 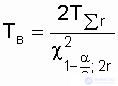 .
.
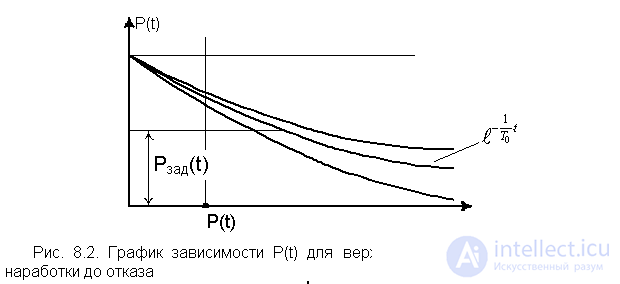
From pic. 8.2 shows that for practical reasons it is more important to determine P n (t). If the value of P n (t) satisfies the specified level of reliability P ass (t) in the time interval from 0 to t, then the true value:

This indicates the reliability margin of the device being analyzed over the time interval from 0 to t.
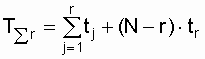
To determine T n and T in according to the expressions (8.3) and (8.4), the total operating time is required  . In tab. 8.1 shows the formula for calculating the total operating time for the most common test plans [3, 19].
Table 8.1
Determination of total operating time for
relevant test plans
 h h | |
=  | |
=  | |
at  = = 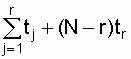 at | |
=  | |
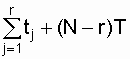
| = NT | |
at  = = at |
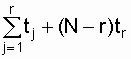
Note: - момент (время) r-го (последнего отказа), r - количество отказов;  - время j-го отказа, 1 Ј j Ј r.
Рассмотрим пример оценки T н по [19].
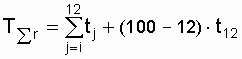
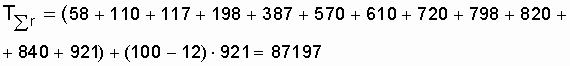
Пример. В результате наблюдений за эксплуатацией неремонтируемых однотипных устройств зафиксированы 12 отказов. После двенадцатого отказа наблюдения прекращаются. Значения наработки до отказа (в часах): 58, 110, 117, 198, 387, 570, 610, 720, 798, 820, 840, 921.
Оценить среднюю наработку до отказа заданного типа устройства, предполагая экспоненциальный закон распределения времени наработки до отказа.
Решение.
Из условия задачи следует, что наблюдения организованы по плану (N, U, r); N = 100,  = 921 ч. В табл. 8.1 по указанному плану находим суммарную наработку всех устройств:
 ;
;
 ;
;
Точечная оценка средней наработки до отказа
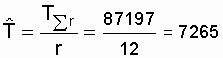 ч.
ч.
Зададимся доверительной вероятностью b = 0,9, тогда a = 0,1. Ограничимся односторонней оценкой (T н ). Нижнюю доверительную границу T н при a = 0,1 определим по выражению (8.4) и по прил. 1:
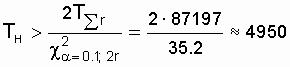 ч.
ч.
Можно с 90%-й уверенностью утверждать, что истинное значение средней наработки до отказа не ниже 4950 ч, и по этой оценке можно определять и другие показатели надежности, например  .
.
This manual addresses the issue of interval estimation of exponential distribution parameters. In the special literature, examples of interval estimation for more complex distribution laws are given (for example, with the normal distribution law in [11, 12], with the truncated normal distribution law in [19]).


Comments
To leave a comment
Theory of Reliability
Terms: Theory of Reliability