Lecture
Before moving on, let's talk about debugging scripts.
All modern browsers support for this "developer tools". Error correction with their help is much easier and faster.
At the moment, the most versatile tools - in the Chrome browser. Firebug is also very good (for Firefox).
Visit the tutorial / debugging / pow / index.html Chrome browser page.
Open the developer tools: F12 or go to Инструменты > Инструменты Разработчика .
Select from above Sources :
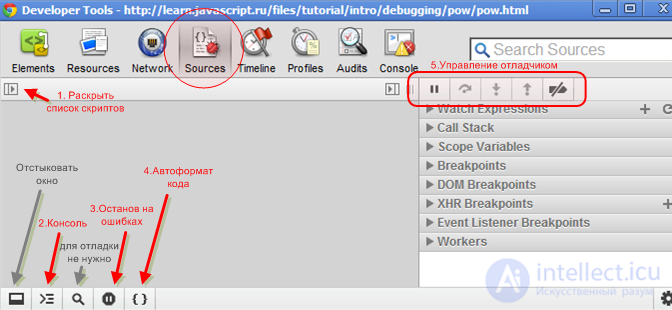
Buttons that we will use:
We went to the page? Expand the list of scripts by clicking on button 1, and select pow.js Click on the 6th line, right on the number 6.
Congratulations! You set your first breakpoint.
The word breakpoint is a commonly used English jargon. In Russian-language manuals, the term “stopping point” is used. This is the place in the code where the debugger will stop the execution of JavaScript as soon as it gets to it.
In the stopped code, you can view any variables, execute commands, etc.
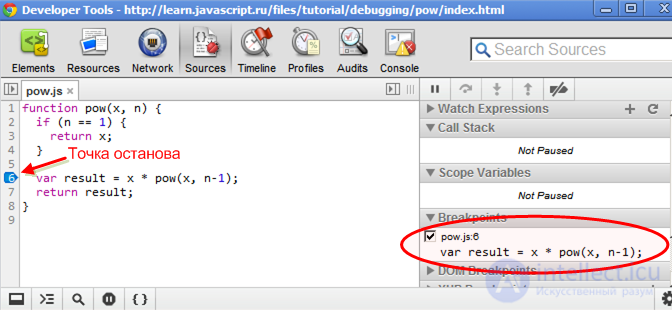
On the right-bottom is the Breakpoints tab, in it you can:
debugger command: 1 | function pow(x, n) { |
2 | ... |
3 | debugger; // <-- отладчик остановится тут |
4 | ... |
5 | } |
This is useful if a stop is needed only for a certain value of a variable or a function parameter.
Our function is executed immediately when the page loads, so the easiest way to activate JavaScript is to reload it. So, press F5.
If you did everything as described above, then execution will abort just on the 6th line.

Pay attention to the informational tabs on the right (marked with arrows).
In them we can see the current state:
Watch Expressions - shows the current values of any expressions. You can expand this tab, click + on it and enter any expression or variable name. The debugger will display its value.
Call Stack - nested calls (otherwise called “call stack”). At the moment, you can see that the debugger is in the function pow (pow.js, line 6), called from an anonymous code (index.html, line 13).
Scope Variables are variables. Currently, line 6 has not yet completed, so result is undefined .
Local shows variable functions: declared via var and parameters. You can also see the this variable there, it is created automatically. If you do not know what it means - do not worry, we will discuss this in the chapter on this context in detail.
In Global , global variables that are outside of functions.
The time has come to drive the script and ottrait "(from the English. Trace, track) his work.
Pay attention to the control panel in it there are 4 main buttons:
 - continue execution (F8).
 Click this button.
You will see that the debugger remained on the same line, but a new call appeared in the Call Stack . This happened because the 6th line contains the recursive call of the pow function, i.e. control passed into it again, but with different arguments.
Go up and down the stack - you will see that the arguments are really different.
 - take a step without going inside the function (F10).
 Click this button.
The debugger will go to line 7. Everything is correct, although there is subtlety.
The fact is that in the pow nested call there is a breakpoint, and the debugger always stops on enabled breakpoints. Even if the nested call and this button is pressed.
... But in this case, the nested call will be with n=1 , so if will work and control will not reach line 6. Therefore, there is no stopping.
 - make a move (F11).
  - perform until exit from the current function (Shift + F11).
 Conveniently, if we inadvertently entered an embedded call, which is not at all interesting to us - in order to quickly get out of it.
 - disable / enable all breakpoints.
 The debugging process is that we stop the script, look at the variables, go further and look for where the behavior deviates from the correct one.
Right clicking on the line number allows you to run the code before it (Continue to here).
This is very convenient if the intermediate lines do not interest us.
When debugging, besides viewing variables, it is useful to run JavaScript commands. For this you need a console.
You can go to it by clicking the “Console” button at the top-right, or you can open it in addition to the debugger by clicking the button  or the ESC key.
The most favorite development team: console.log(...) .
She writes the arguments passed to her in the console, for example:
1 | // результат будет виден в консоли |
2 | for ( var i=0; i<5; i++) { |
3 | console.log( "значение" , i); |
4 | } |
Full information on special console commands you can get at http://firebug.ru/commandline.html. These commands also work in Firebug (a debugger for the Firefox browser).
The console supports all browsers, but IE <10 does not support all functions. Logging works everywhere, use it instead of alert .
JavaScript errors are displayed in the console.
For example, open the tutorial / debugging / pow-error / index.html page. You can stop the previous debugging (clear breakpoints and then continue ).
In the console you will see something like this: 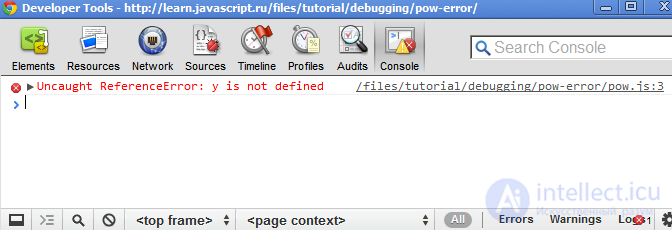
Yes, indeed, this is because there is an error in this script. But what's the matter? Let's see what the variable values were at the time of debugging. To do this, let the debugger stop at an error by double-clicking on  (until purple).
By the way, to see this button, you need to be in the Sources tab, not in the Console.
Now reload the page. The debugger stops at the line with the error:
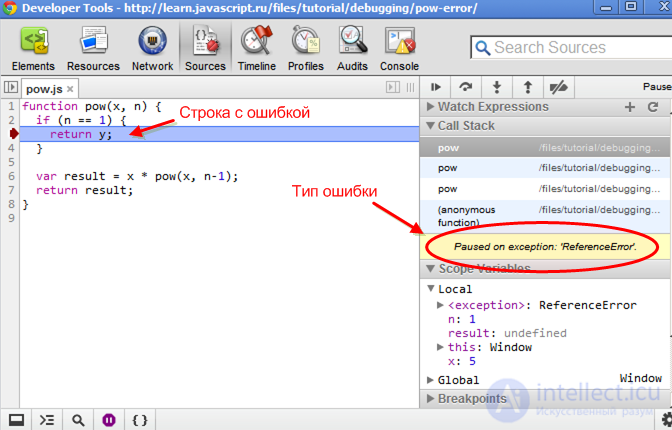
You can see the values of variables. Put break points before the code and see what led to such a sad picture.
In this case, everything is simple: a typo in the name of the variable y instead of x . This type of error is called ReferenceError .
The debugger allows you to:
debugger command. This article briefly describes the features of the Google Chrome debugger related specifically to working with code.
So far this is all we need, but, of course, developer tools can do a lot more. In particular, the Elements tab allows you to work with the page (you will need it later), Timeline — see what the browser does and how much it takes, etc.
You can learn in two ways:

Comments
To leave a comment
Scripting client side JavaScript, jqvery, BackBone
Terms: Scripting client side JavaScript, jqvery, BackBone