Lecture
Example 1
Consider a discrete random variable and, by test, we mean getting its next value. Let's try to predict the result of the test, that is, to predict the value that the random variable will take. Of course, due to the randomness of the considered value, the outcome of the test carries some uncertainty, but, knowing the distribution law, we can try to assess the reliability of the forecast to some extent.
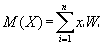
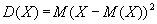
It is natural to try to use for this purpose the mathematical expectations (M (X)) and dispersions (D (X)) that are already known from the theory of probability and mathematical statistics:
However, it turns out that for predicting the value of a random variable these characteristics may be useless. This can be seen in the following example.
Let two random variables with the following distribution laws be given:
|
|
Find their expectations and variances:
M (x) = 0 * 1/2 + 1 * 1/2 = 1/2,
M (y) = 1/3 * 0.9 + 2 * 0.1 = 1/2.
Thus, the mathematical expectations of these random variables are the same. The same applies to dispersions.
Really,
D (x) = 0 2 * 1/2 + 1 2 * 1/2 - 0.25 = 0.25,
D (x) = 1/3 2 * 0.9 + 2 2 * 0.1 - 0.25 = 0.25.
However, it is intuitively clear that the distribution law y carries with it much less uncertainty and makes it possible to predict with rather high reliability that the result of the test will be y = 1/3. Therefore, neither the mathematical expectation nor the variance can be used as a measure of the uncertainty of the distribution.
Let us calculate, by formula (5), the entropy of the above distributions. For convenience of calculation, logarithms will be considered natural.
For a random variable x, we get
I = -2 * 0.5 * ln 0.5 = 0.6931;
the entropy of the distribution is yI = -0.9 * ln 0.9 - 0.1 * ln 0.1 = 0.1054 * 0.9 + 2.3026 * 0.1 = 0.3251,
that is, the entropy of the distribution x is more than twice the entropy of the distribution y. This ratio is quite consistent with the intuitive idea of the uncertainty of the available distributions.
Example 2
The probability of an event occurring during one test is W. For which W, the test result has the greatest uncertainty.
If the random variable is the number of occurrences of an event in a given test, then it is described by the scheme
| x | 0 | one |
| W | 1-w | W |
According to formula (5), the entropy of this scheme is
I = - (1-W) * ln (1-W) - W * ln W.
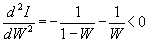
For convenience of calculations, we assume that the logarithms are taken natural and we find the maximum of this function:
dI / dW = ln (1 - W) + 1 - ln W - 1 = ln (1-W) - ln W.
Equating dI / dW to zero, we find ln (1-W) = ln W, whence W = 1 - W = 1/2. Because

Comments
To leave a comment
Synergetics
Terms: Synergetics