Lecture
In fact, content analysis of advertising is a hybrid of quantitative and qualitative approaches. In general, this is a fairly common method of research, but popularity, as is known, always entails vulgarization. Not escaped such a fate and this research tool. It is often possible to hear in a variety of situations (when presenting a media plan or at the time of reviewing the advertising activity of competitors) that such and such conclusions are made on the basis of content analysis. At the same time, it is usually difficult to explain what exactly was carried out. However, if used properly, content analysis helps to study advertising practice as a whole very well, track specific advertising strategies and draw conclusions about the effectiveness or inefficiency of advertising campaigns.
The main purpose of content analysis in relation to communications is to identify the most common trends that are not muddied, so to speak, by the specifics of any particular market or product category. For example, gender roles, the types of sales offers used, the prevalence of collectivism or individualism in advertising messages, the presence of international and cross-cultural characteristics, etc. Research of this type is typical not only for scientific institutions and academic circles, but also for serious advertising agencies. It is clear that we are more interested in the second case: the practical use of the method. How can content analysis be useful?
To answer this question, we will take a few steps back and once again indicate that decisions about planning an advertising campaign are not made in a vacuum. Smart always learns from the mistakes of others, so the choice of certain tasks, methods and tools will be more realistic if you have information about advertising strategies and advertising campaigns of competitors, their successes and failures. Not less important, such an analysis helps to build up from competitive advertising, to find its own, special position in the minds of consumers. What, in the end, significantly increases the chances of success: for the third or fourth time it is just silly to say the same thing to the same people. All the concepts of the unique selling proposition mentioned above, positioning, etc., were actually invented mainly in order to distinguish more honorablely “our” product or brand against the background of “strangers”.
It is clear that we cannot reveal the effectiveness of communications using only content analysis, but the merits of this method become truly invaluable when used in combination with other types of research. The interrelations between the characteristics of advertising and its influence on the target audience become quite distinct, and certain results, whether success or failure of the campaign, become much more understandable.
In order to better explain what content analysis can help in identifying the effects of advertising, you must first understand what it is and how the procedure for content analysis of advertising is carried out. Denote the three whales on which this research method stands:
Consider them in more detail.
Consistency . The degree of reliability of the content analysis results directly depends on the correct following of the procedure (rules) - from sampling to the form of presentation of results. The rules must fully cover the whole process, be explicit, unambiguously interpreted, and correspond to the goals of the analysis.
Objectivity The conclusions of the content analysis can be considered justified only if the analysis was carried out by sine ira et studio1, i.e. the researcher should distance himself as much as possible from his personal likes and dislikes up to the degree of mild schizophrenia (“I should not influence the I-researcher”).
1 Without anger and addiction (from Tacitus).
Measurability This content analysis is based on the number. Digitizing the selected array of advertising messages allows you to improve the accuracy of judgments, more meaningfully describe the results and the relationship between individual elements of advertising. For example, the conclusion is much more specific and accurate: “90% of all analyzed advertisements of competitors contain a dual statement“ less fat and cholesterol ”than“ most of our competitors pay attention to the benefits of healthy food in their advertisements ”. Finally, digitization allows for further analysis of the multivariate statistical analysis procedure, which contributes to a greater depth of understanding of the collected data, allows you to remove random information noise and reveal significant links between various parties of both individual advertising messages and the aggregate advertising campaigns in general.
Due to the fact that the content analysis procedure itself is poorly covered in the available sources, let us dwell on it in more detail. In fig. we led the general sequence of the method.
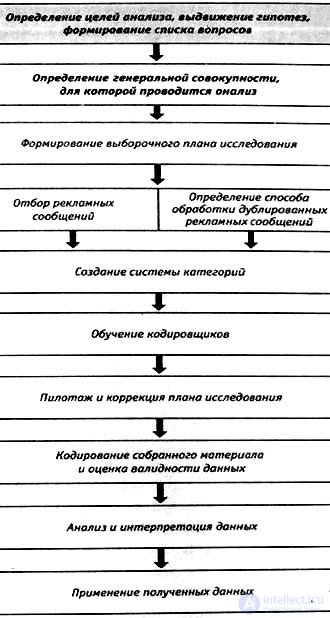
Like most studies, content analysis begins with identifying a problem, setting goals, putting forward hypotheses. Hypotheses can be generated on the basis of theoretical background, previous research and / or experience, changes in market conditions and prospects. Often, hypothesis suggests a link between various variables, for example: “ Previous studies have shown that advertising is characterized by a less aggressive, less self-confident, more public and more supportive model of interpersonal communication for women than for men. It is hypothesized that this model of communications can also be characteristic in advertising for business women, a businesswoman . ” Or: “ Reforms in Russia have led to a dramatic change in the role of adults as the main breadwinners in households. The income of young people, often earning an order of magnitude more than their parents, is beginning to arouse great interest. Hypothesis for analysis: did the changes in raising the social status of young people lead to a change in the direction of advertising appeals in the market of electrical appliances? "
In turn, the hypotheses are divided into a number of questions that specify the analyzed situation. For example, we hypothesized that cigarette advertising contains various messages depending on the opposition on the basis of “ours are not ours”. Accordingly, we can formulate clarifying questions:
In the analysis of competitive advertising the following questions are usually asked:
Of course, the list of questions is completely determined by the objectives of the study and in each case is established by the researcher.
The general set of materials to be analyzed is determined on the basis of goals and objectives and the formulated hypotheses. Proper definition of the general population avoids ambiguity, ambiguity, and clearly defines the study glossary.
Suppose we defined the general aggregation as follows: "Content analysis of advertising competitors in our market." Such a definition of the general population is quite a normal requirement of the advertiser, but completely unsatisfactory, because it does not allow to understand: what is meant by competitors? All manufacturers in this product category? Manufacturers of national or local brands? Or only leading brands, including imported ones? Or those manufacturers whose advertising budget is comparable to ours? What does “advertising” mean in this case? Is advertising in all media implied? Or just TV ads? Or just print? Do we need to take into account in the analysis of direct mail and other means of product promotion? What is the analysis period? Last two weeks? Two years? From June 1 to August 31?
In short, the query is such that counter-clarifications on it may take an order of magnitude longer than its initial formulation and, possibly, the solution. Therefore, is it not better to specify at once what is needed? The following wording will look much more professional: “ The subject of the content analysis is the advertising of the toothpaste of the brands Aqua Fresh, Colgate, Blendamed, New Pearl. The advertisements placed on ORT, RTR, NTV and national newspapers from January 1 to February 28, 2004, are being studied. ” Perhaps, it also does not reflect all the features of the definition of the general population, but at least it is possible to work with it. ;
A sample plan determines how advertisements will be selected from the entire population. It is very rare, but there are also such cases when the entire genus population (census) is investigated. This is possible if the set of materials selected for analysis has finite observable limits, for example, the advertising of all cars in COSMOPOLITAN magazine for 2002;
There are three reasons why it is sometimes necessary to investigate the entire gene aggregate. Firstly, often the number of competing advertisements is limited to a relatively small number of advertisements. Secondly, the requirements for the reliability of the content analysis results used to make business decisions are sometimes quite high. If you create a sample based on a small aggregate population, the chances increase that random “outliers” or unrepresentative advertising options will affect the results. Thirdly, in countries with a developed market of marketing research reports of specialized companies are available, made on the basis of practically the entire population, for example, in the USA - Radio-TV Reports. The availability of such data significantly reduces the time for searching and collecting information, allowing the researcher to focus on analyzing data.
If the content analysis is carried out to identify trends in advertising practice, the population should include a very wide range of advertisements in all media and for quite long periods of time. In this case, it is almost impossible to analyze all advertising, and sampling is a logical step. We will not consider here the principles and methodology of sampling, as there is a fairly extensive literature on this topic. We note only two general principles:
An example of building a sample for content analysis
With the help of a computer program, advertisements are selected in such a way that on each day of the study period four combinations of 7 television channels and five time intervals are obtained. Channels: ORT, RTR, NTV, TVC, STS, Ren-TV and cable channel. Channels were selected by rating channel viewing in Moscow. The time intervals are 7:00 am-11:00 am 11:00 am-4:00 pm, 16:00 am to 7:00 pm, 9:00 pm-2:00 pm and 8:00 pm. Period - September 2002. All announcements that fall into selected combinations, including duplicated ones, are considered.
The given example is quite simple. Often, the samples are based on a multi-step procedure with different selection algorithms at each step.
Often advertisements appear in the media more than once during the time period studied. Even during one television program and even in one ad unit, several identical commercials can be released. It is clear that this leads to their duplication in the sample. The decision to further process such messages (consider each of them as separate or exclude duplicates) depends on the tasks facing the researcher. In some cases, the presence of duplicates is ignored and all data is processed, i.e. Each double is considered a separate announcement. This approach is valid in the case when the subject of analysis are aspects of the impact of the entire array of ads. For example, it is necessary to identify the use of sexual motives in men's illustrated magazines, then duplicate ads are important in terms of their weight and viewing exposure. However, if the research focus is on advertising a specific competitor or promotion strategy, duplicate messages should be ignored, since we are interested in the informative elements of advertising messages, and not the frequency of their appearance.
The creation of a category system consists of two stages: 5.a) identification of the categories of interest to us and 5.6) creation of a list of characteristic measurements for them.
5a. Category Identification
At this stage it is necessary to identify all meaningfully significant categories. The set of categories should be comprehensive, i.e. cover all the features of the ads in question. Categories should have clear names that are directly related to the subject of the research and the hypotheses put forward. B. Berelson pays special attention to the direct link between the ultimate success of content analysis and the clear wording and adaptation of categories to the problem under investigation and the content of announcements1. F. Curlinger2 and K.Kripendpendorf3 also note the special influence of the definition of the category system on the final result.
1 For details, see: B. Berelson. Content Analysis in Communication Research. NY: Hafner, 1952
2 For details, see: Kerlinger F. Foundations of Behavioral Research. NY: Holt, Rinehart & Winston, 1973.
3 For details, see: K. Krippendorf. Content Analysis: An Introduction to Metodology. Beverly Hills, CA, Sage Publishers. 1980
Here are some examples of a set of categories to learn:
1) competitive advertising
2) an advertising campaign for women politicians (Table 1);
Table 1. Comparison of two categories
| Competitive Advertising | Political advertising |
| Ad format | Ad format |
| Ad structure | Presentation style |
| Main product benefits | Length of performance |
| Additional product benefits | Scenery |
| Type of offer | Speaker type |
| Tone of presentation | Voice Type |
| Musical accompaniment | Clothing style |
| Type of trademark identification | Political topics mentioned |
| Product demonstration | Dominant theme |
| Product environment | |
| Use comparative advertising |
5 B. Creating category dimensions
At this stage, each category is deployed in a variety of dimensions that define it. In addition, rules are inevitably established according to which a category will be measured after determining its dimensions. The dimensions of categories can be taken from various sources: from marketing theory, from previous studies, from the personal experience of a researcher in a given product group, etc. In any case, regardless of origin, the dimensions must define a consistent non-contradictory measurement system. It is quite obvious that they can be of different types. The main thing is that they adequately describe the presence or absence of a particular trait, the amount of the trait or its typology, for example, see table. 2
Table 2. Example of setting the categories dimension
| Product presentation | Product display time in seconds |
| The use of female sexual images | • Yes • not |
| Advertising format | • speaker only • stylistic • household scene • advisory • celebrity approved |
| The degree of emotion - rationality | • only rational motives • rather rational motives • both rational and emotional motives • rather emotional motives • only emotional motives |
As can be seen from the above list, categories and their dimensions can be interpreted as types of questions and answers in questionnaires or types of variables (categorical, ordinal, interval) in statistical analysis. Therefore, we will not consider categories in detail; we will only dwell on the question of the number of dimensions in categories. There is no definite answer. On the one hand, the number of dimensions should be sufficient to identify significant differences within the category. Suppose you want to analyze the advertising of some food product in the category “Healthy food”. Then such dimensions of the category as “Lack of Fat”, “Lack of Cholesterol” 1, “Good for Health” will not allow you to fully embrace such a thing as “Healthy food”. On the other hand, excessive fragmentation of the category, for example, “Presence of vitamin A”, “Presence of vitamin B4”, “Presence of vitamin C”, etc. - clearly does not improve the understanding of this category and most likely will only lead to difficulties in coding. Поэтому при создании единой системы категорий и размерностей приходится руководствоваться тремя банальными вещами, о которых не вправе забывать ни один исследователь: элементарным здравым смыслом, имеющимся опытом и обязательным пилотажем.
1Здесь авторы допустили умышленную фактическую ошибку. В целях, так сказать, наглядной демонстрации того, что, приступая к контент-анализу, неплохо бы самому «быть в контенте». Например, вопреки широко распространенному заблуждению, холестерин бывает как вредный, так и полезный: так называемый холестерин высокой плотности и холестерин низкой плотности. Поэтому, формулируя категории и задавая им размерности, всегда полезно для начала осуществить своего рода погружение (immersion) в изучаемую проблематику.
В завершение темы укажем, что многие специалисты рекомендуют при наличии сомнений на всякий случай трактовать их в сторону большего числа размерностей. Их можно понять: объединить размерности в более крупную группу после кодировки можно, а вот разделить на более мелкие — уже нет.
По сути, кодовая книга — это словарь проводимого вами контент-анализа. Она должна содержать определения всех терминов, которые используются в анализе. Создание кодовых книг необходимо для того, чтобы все кодировщики понимали анализируемые сообщения максимально одинаково. Принципы создания кодировочных листов аналогичны принципам создания вопросников, только записываются в них не ответы респондентов, а результаты анализа кодировщиками рассматриваемых рекламных объявлений (табл. 3).
Tab. Codebook example 1
1 Taken from: Stewart D. Furse D. Effective Television Advertising. Lexington, MA: Lexington Books, 1986.
| Category : Ad structure in a 3040 second TV spot. Use of unexpected and unpredictable elements in advertising. Five dimensions. | |
| Surprise at the beginning | The use of elements that attract attention (incomprehensibility, surprise, stress, implicit questions) in the first 10 seconds. advertising |
| Surprise in the middle | The same, but in the middle of advertising (10-20 sec) |
| Surprise at the end | The same, but at the end of the advertisement (last 10 seconds) |
| Unexpected environment, application | Display of the product in an unexpected interior, perspective, application |
| Use of humor | Using jokes, puns, gags, farce or other elements of humor |
| Category : Main and additional advertised product benefits. The main benefit in advertising is given maximum attention. Additional benefits are mentioned only as added to the main benefit. | |
| Price | The product has a low or lowest price in this category. |
| Price-quality ratio | The best price / quality ratio |
| Cleaning abilities | Removes both grease and stains from wine, juices, etc. |
| Concentration | Results are achieved with less product consumption. |
Table 4. Sample coding sheet
Advertisement No. __________ |
30 sec TV spot Инструкции: Отмотайте пленку на начало. Обнулите секундомер. Просмотрите весь ролик. Отметьте время появления всех наблюдаемых элементов структуры рекламы. Если таких элементов в рекламе нет, отметьте код «Нет таких элементов в рекламе». ___ Неожиданность в начале |
Основная рекламируемая выгода Инструкции: Просмотрите все объявление. Отметьте галочкой только одну рекламируемую выгоду, на которой сосредоточено основное время рекламы. Price |
Дополнительные выгоды. Инструкции: Просмотрите все объявление. Отметьте галочкой каждую рекламируемую выгоду, упомянутую в рекламе, кроме основной рекламной выгоды (см. предыдущую категорию). Price |
Из всего вышеизложенного следует, что к отбору и обучению кодировщиков надо подходить со всей тщательностью. Во-первых, кодировщиков должно быть не менее двух. Во-вторых, это должны быть люди с примерно одинаковым опытом и навыками кодировки. В-третьих, важным условием является независимость этих кодировщиков друг от друга и от исследователя, подготавливающего кодовый план. К. Криппендорф особенно отмечал это условие, настаивая, что не может быть ничего хуже, когда кодировкой занимается сам исследователь или же при помощи своих коллег, также участвующих в данном исследовании.
Процесс обучения состоит из ряда этапов. Вначале кодировщики внимательно знакомятся с категориями, их определениями и размерностями категорий, которые представлены в кодовой книге. Это часто игнорируемый, но очень важный этап. Ниже у нас будет возможность проиллюстрировать насущность погружения в исследуемую категорию. После инструктажа кодировщики переходят к практическим занятиям, на которых 1) им показывают образцы объявлений, отобранных для кодировки; 2) которые они кодируют в соответствии с полученными инструкциями; 3) по результатам практической работы проводится обсуждение возникших проблем, оценивается качество кодировки и, при необходимости, проводится дополнительный тренинг.
Любой план может быть усовершенствован или скорректирован. Не является исключением и контент-анализ, в котором обязательной стадией является пилотаж кодового плана. Предметом пилотажа является усовершенствование категорий, размерностей, кодировочных листов и инструкций кодировщикам. Обычно пилотаж проводится после обучения кодировщиков на одном и том же наборе объявлений.
Рассмотрим гипотетическую ситуацию. Три кодировщика проанализировали 10 рекламных объявлений и отнесли их к той или иной размерности некой категории (табл. 5)
Таблица 5. Пример кодировочного листа
| Кодировщик | Dimension | Разм.-сть 2 | Разм.-сть 3 | Разм.-сть 4 |
| one | 2,3,6 | 1,4,8 | 5,7,10 | 9 |
| 2 | 1,4,8 | 79 | 5,10 | |
| 3 | 2,3,6 | 1,4,8 | ten | 5,7,9 |
Как видно, размерности 1 и 2 хорошо определены: у кодировщиков не возникло разногласий по по поводу того, какие объявления отнести к этим размерностям. Однако для размерностей 3 и 4 мнения кодировщиков не совпали, причем весьма кардинально. Следовательно, дефиниции размерностей 3 и 4 должны быть пересмотрены до начала основного анализа.
Вторая задача, которую решает пилотаж, — это оценка степени готовности самих кодировщиков. При затруднении кодировки той или иной категории возможен дополнительный тренинг отдельных кодировщиков. При систематическом несовпадении мнения одного из кодировщиков с остальными он может быть полностью исключен из процесса кодировки.
Обучив персонал и отладив кодовый план, можно проводить кодировку основной выборки рекламных объявлений. После того как этот процесс завершен, необходимо оценить надежность кодировки. Под надежностью (достоверностью) в контент-анализе понимается высокая вероятность того, что два и более кодировщика, работая независимо друг от друга, присвоили одни и те же коды одним и тем же элементам в каждом из проанализированных рекламных объявлений. Данный тип надежности, называемый межкодировочной надежностью, может вычисляться по разным методам, но должен быть обязательно проверен до анализа полученных данных. Низкий уровень вычисленной надежности свидетельствует о том, что полученным данным доверять нельзя.
Холсти1 для вычисления межкодировочной надежности для номинальных категорий рекомендует крайне простую формулу:

Как видно, метод понятный, простой в вычислениях, однако имеющий тенденцию завышать надежность кодировки, так как не учитывает, что коды могут совпасть и случайно. Допустим, у нас категория имеет две размерности (да — нет). Нетрудно видеть, что, закодировав выборку два раза (имитируя работу двух кодировщиков) с помощью генератора случайных чисел, мы получим надежность, равную примерно 50%. Для решения этой проблемы существуют и другие, более сложные формулы. Однако и они не универсальны, поскольку чувствительны к другим аспектам кодировки. Например, в π-индексе2 надежность вычисляется с коррекцией на случайные совпадения:
1Подробнее см.: Holsti О. Content Analysis for the Social Sciences and Humanities. Reading, MA: Addison-Wesley Publishing Co., 1969.
2 For details, see: Scott W. Reliability of Content Analysis: The Case of Nominal Scale Coding. Public Opinion Quarterly, No. 61.1955. P. 483-492.

where R is the reliability indicator (Reliability), M is the total number of matched code elements of two encoders, Nl N2 is the total number of encoded elements of the 1st and 2nd encoder, respectively. For example, if in 80 cases out of 100 the opinions of the coders coincided, then the Canvas reliability is:

where π is the reliability estimate, K0 is the percentage of observed encoder matches, Ke is the percentage of expected matches. The disadvantage of this index is its sensitivity to the type of distribution of coded elements. Although the method of counting it is extremely simple: at the first stage, the percentage of expected matches is calculated, then, using the Canvas formula, the percentage of observed matches is calculated. Substituting these values into the formula, we get the π-index. For example, in our hypothetical example with cleaning products, the main advertised benefits were distributed as follows (%):
Then the percentage of expected matches is 0.205 (0.302 + 0.252 + 0.152 + 0.1002 + 0.102 + 0.102 = 0.205), and we take the percentage of observed matches from the previous example - 80%. Then:

Perrot and Ley [1] developed a different approach to correcting inter-coding reliability. This formula is also not free from shortcomings, in particular, it depends on the number of dimensions in the category. In canonical form, it looks like this:

where F0 is the number of matched code elements, N is the total number of code elements, k is the number of dimensions in the category. For example, taking the previous data, we get F0 = 80, N = 100, k = 6. The Perro-Leah reliability estimate will be:

1 For details, see: Perreauit WD, Leigh LE Reliability of Data Based Qualitative Judgments // Journal of Marketing Research. 1989. 26. P. 135-148.
But perhaps one of the most frequently used consent measures is Cohen's kappa 2, which is calculated by the formula:

where πjj is the probability that encoder 1 encodes an object of dimension i, and encoder 2 encodes the same object of dimension j. Or, in other words, it is the difference between the shares of consonants and dissent answers divided by the difference between 1 and the share of dissent answers:

It is clear that kappa (() can vary from 1 (full agreement of two coders in the evaluation of objects) to -1 (complete disagreement). A special case when the kappa is 0. This means that one might as well ask to evaluate objects two random number generators.
2 For details, see: Cohen J. A coefficient of agreement for nominal scales. Educational and Psychological Measurement. 1960. 20. 37-46.
All the above formulas are intended for nominal categories, and all are used to some extent in content analysis. But, regardless of the formula used, a reliability level of at least 80% is considered acceptable.
To assess the reliability of the ordinal and interval categories, ordinary correlations and rank correlations are used. However, there is a danger of an error in assessing the reliability associated with the fact that the correlation coefficients indicate the direction of the connection, without saying anything about the values themselves. Suppose, on a 5-point scale, we estimate the level of emotional motivations in advertising, where 1 is “total absence of emotional motivations” and 5 - “the presence of only emotional motivations” (Table 6):
Table 6. Example of a table for comparing the ratings of different encoders
| Roller number | Encoder Evaluation 1 | Encoder Evaluation 2 |
| one | one | 3 |
| 2 | 2 | four |
| 3 | 3 | five |
We consider the rank correlation coefficient. We get +1.0, 100% reliability, although even by sight it can be seen that Encoder 1 estimates the presence of emotional motives in advertising much lower.
Analysis of the data obtained after encoding advertisements follows the logic of conventional quantitative research methods — percentages, averages, medians, mods are calculated, cross-tables are constructed, significant differences, etc. Therefore, we will not dwell at this stage. Those interested can learn more about the methods of analysis of the relevant literature1.
The purpose of content analysis is to help in a better understanding of advertising practice in general, the features of specific advertising strategies, the study of a competitive advertising environment.
As for the links between elements of advertising and advertising effectiveness, then, remaining within the framework of content analysis only, it is impossible to explore these links. However, the combination of content analysis of advertisements and the simultaneous study of consumer behavior (knowledge, attitudes, response) makes it possible to identify these links not at the level of reasoning about common sense or intuition (as one character of Gennady Khazanov said: “I feel blond with my spinal cord”) using rigorous mathematical procedures.
Consider an example of a similar study by the Institute for the Study of Readership2. This institute was founded in 1999 on the initiative of the Newspapers' Association of America. Its main task is the most complete and in-depth study of the readership. The main project of the institute is Impact Wave Research, based on a study of a sample of 100 daily and Sunday newspapers, as well as surveys of respondents on a total annual sample of 37,000 people. The polls examine the media preferences of respondents (and newspapers, in particular), their reactions to read, consumer behavior. In the content analysis, 74,000 articles were examined, covering all types of news, as well as some types of advertising. Such a two-sided approach makes it possible to identify the links between the contents of newspapers and the reaction of readers, their satisfaction with the materials and the ways of their presentation. In addition, editorial teams and journalists are the subject of study.
1 For details, see: Malhotra N. Marketing Research. A practical guide. M .: Publishing House "Williams", 2002. Churchill G.A. Marketing research. SPb .: Peter, 2000.
2 Readership Institute, Media Management Center division at Northwestern University. USA. readership.org.
Key research questions are:
The wide distribution of content analysis is hampered by a large proportion of manual labor and, accordingly, the lengthy periods for obtaining results. In a dynamic situation of emerging markets, when the road is every week, and sometimes every day, the basic procedure of content analysis is not popular. In principle, a significant reduction in analysis time is possible, if at the stages of hypothesizing and forming a category system, we abandon the preliminary study of advertising messages and set up a priori hypotheses and the same category system. However, this approach suffers from the strong influence of the personality of the researcher (or customer), i.e. the very subjectivity from which the method of content analysis tries to escape. One of the possible ways out of this situation is the use of new information technologies.
Assessing in general both theory and examples of content analysis, we would like to note that this method in combination with other methods of advertising research can be a powerful tool for analyzing the effectiveness of advertising. Of course, if he is in experienced hands. The main advantage of content analysis is that it allows you to identify objective links between the content of advertising or some of its characteristics) and the impact of this advertising on potential consumers. And all this is done not approximately, “by eye”, but on quite scientific grounds.
Bibliography
Kutlaliev A., Popov A. Advertising Efficiency. - M., 2005
See also:
Content analysis: essence, tasks, procedures
Content Analysis: Method Description
Conducting content analysis
Political Content Analysis

Comments
To leave a comment
Mathematical Methods in Psychology
Terms: Mathematical Methods in Psychology