Lecture
A characteristic of the work of the queuing system are indicators of the effectiveness of the service system. In various tasks of research of queuing systems, various performance indicators are the main ones.
Performance indicators can conditionally be divided into three large groups:
One of the most important indicators of the effectiveness of the queuing system is the value of Rothk - the probability that the incoming request refuses to join the queue and is lost.
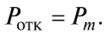
Loss of demand in systems with a limited queue length can occur only due to the fact that at the time of the next request, the queue of pending requests has the maximum allowable value /. In systems with failures, the requirement is lost if it arrives at the moment when all devices (channels) are occupied. In systems with expectation, this indicator does not make sense, since any incoming request remains in the system. Obviously, for a system with Rothk failures, it is equal to the probability that the number of requirements in the system is equal to the number of devices, i.e.
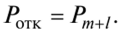
For a system with a limited queue length, Rothk is equal to the probability that there are m + / requirements in the system , i.e.
The second important indicator of effectiveness related to the first group is the average number of requirements awaiting service - May. This indicator for queuing systems with a limited queue length can be found by the formula

where Pn is the probability that there are n requirements in the system , of which n m are in the queue.
The average number of requirements in the service system both in the queue and in the service can be found by the formula 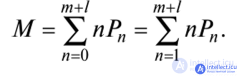
The first group of indicators includes the average waiting time by the requirement to start servicing the identity.
If the distribution function of the probability of waiting time is known by the requirement to start service
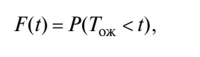
then the average waiting time for Gozh can be found as the mathematical expectation of a random variable Gozh
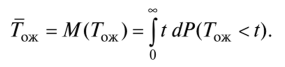
If the average time for servicing a requirement is known and is equal to Gob = M (Gob), then the average residence time of a requirement in the system is determined as the sum
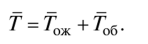
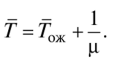
With the exponential law of the distribution of service time, this formula takes the form
Among the indicators of the second group should first specify the average number of occupied service equipment - PSU
This number for a system with failures can be determined by the formula 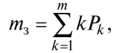
where m - the total number of service units, Pk - the probability that the system is a requirement and, accordingly, are busy to the devices.
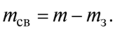
The opposite of the last indicator is the average number of free-of-service devices - tsv.
Since for a system with failures, the probability that there are & requirements in the system, i.e. This is evidenced by the site https://intellect.icu. occupied & appliances, equal to the probability that t - k appliances will be free, then the average number of free-of-service appliances is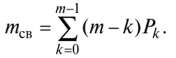
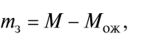
For a queuing system with a limited queue length t3 can be found as the difference:
and the average number of free devices is the difference between the total number of devices and TK:
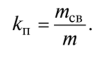
The last two characteristics are related to characteristics such as equipment load factor

and downtime
One of the characteristics of the same group is the likelihood that all devices in the system are busy servicing P3 requirements . This probability is equal to the probability that exactly m requirements are in service . For a system with failures, this means that exactly t of the requirements are in the system:
For queuing systems with a limited queue length, the probability that exactly t devices are engaged in servicing is equal to the sum of the probability that 1, 2, ... requirements are waiting for service, and the probability that exactly t requirements are in the system :
The indicators of the third group are usually used at the final stage of the study of the system after the evaluation of the indicators of the first and second groups.
Among these indicators, one can note the amount of losses received in different queuing systems, and the amount of profit calculated as the difference between the income received from operating the system and losses over a certain period of time.
The amount of losses for queuing systems (QS) with failures, waiting and a limited queue length is found by the following formulas.
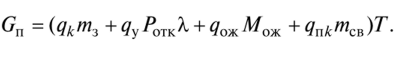
1. QS with failures:
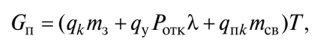
whereqk is the cost of operating one device per unit of time, qy is the cost of losses resulting from the departure of the requirement from the system, qnk is the cost of downtime of one device per unit of time, T is the time interval.
2. QS with the expectation:
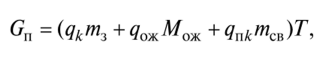
whereqoyK is the cost of losses associated with waiting for a request in the queue per unit time.
3. QS with limited queue length:
The amount of profit is calculated by the formula
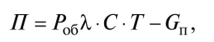
whereC is the income received from servicing one device,
In order to evaluate and optimize the quality of service in a commercial bank, this article discusses the analytical method of the theory of queuing, proposes a system of indicators of the quality of the bank as an open queuing system with anticipation. An example of calculating the number of specialists in operating offices using the proposed method is given. The proposed approach can be used in developing programs to increase the competitiveness of commercial banks.
Currently, the quality of service as an element of business communications is developing as the market infrastructure is saturated with commercial banks and competition intensifies. The need for an integrated strategic attitude towards customers is growing, which makes the quality of service one of the most important factors in the competitiveness of a commercial bank in the market, especially since the influence of price factors on mass services is weakening. To plan the number of specialists, evaluate and optimize the quality of customer service, you can use the methods of queuing theory.
Queuing theory (TMT) is an area of applied mathematics that analyzes processes in production, service, and control systems in which homogeneous events are repeated many times.
The subject of the study of queuing theory are queuing systems (QS). A queuing system is understood as an object (enterprise, organization, etc.), the activity of which is associated with the multiple implementation of the execution of some of the same tasks and operations [1].
The purpose of TMT is to develop recommendations for the rational construction of queuing systems, the organization of their work and the regulation of the flow of applications to ensure high functioning efficiency.
The tasks of the queuing theory are of an optimization nature and ultimately include the economic aspect of defining such a system variant that will ensure a minimum of total costs from waiting for service, loss of time and resources for service, and downtime of service channels.
The QS includes the following elements: incoming flow of requirements, queue, service devices (service channels), output flow of requirements (Fig. 1).

Requirement (application) - each individual request for the performance of any work.
Incoming flow of requirements - requirements coming from all sources to the serving system.
A queue is a collection of requirements awaiting service.
Service Channel — A service consisting of a sequence of maintenance phases. Service phase - a sequence of operations performed on a separate service unit.
Claims outflow is the flow of requests leaving the system after servicing.
For the simplest flow, the frequency of receipt of requirements in the system obeys the Poisson law, that is, the probability of receipt of exactly k requirements in time t is given by the formula

The simplest flow has three main properties: ordinary, stationary and lack of aftereffect.
The uniformity of the flow means the practical impossibility of the simultaneous receipt of two or more requirements (the probability of such an event is immeasurably small in relation to the considered period of time when the latter tends to zero).
A stream is called stationary, for which the mathematical expectation of the number of requirements entering the system per unit time (?) Does not change in time. Thus, the probability of a certain number of requirements entering the system during a given period of time? T depends on its value and does not depend on the origin of its reference on the time axis.
This property expresses the invariance of the probabilistic flow regime over time. This means that the number of requirements entering the system at equal intervals of time should be constant on average [2].
The absence of aftereffect means that the number of requirements received by the system before time t does not determine how many requirements enter the system over a period of time from t to t +? T.
The latter property determines the mutual independence of the receipt of one or another number of service requirements at non-intersecting time intervals. This means that the number of requirements arriving in a given period of time does not depend on the number of requirements served in the previous period of time.
In practice, the conditions of the simplest flow are not always strictly fulfilled. Often there is a non-stationary process (at different hours of the day and different days of the month, the flow of requirements can change, it can be more intense in the morning or in the last days of the month). There is also a consequence, when the number of requirements for the provision of services at the end of the month depends on their satisfaction at the beginning of the month. The phenomenon of heterogeneity is also observed when several clients arrive at the bank at the same time for services [3].
However, on the whole, the Poisson distribution law with a rather high approximation reflects many queuing processes.
An important characteristic of QS is the service time requirements in the system. The service time of one requirement is, as a rule, a random variable and, therefore, can be described by the law of distribution. The most widespread in theory and especially in practical applications is the exponential law of service time distribution.
The distribution function for this law has the form
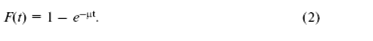
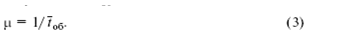
That is, the probability that the service time does not exceed a certain value t is determined by formula (2), where? Is the parameter of the exponential law of the distribution of service time requirements in the system, that is, the reciprocal of the average service time
Consider the analytical model of the most common queuing systems with expectation, that is, those in which the requirements that arrived at the time when all the service channels are busy are queued and served as the channels become free [4].
The general statement of the problem is as follows. The system has n serving channels, each of which can only serve one requirement at a time.
The system receives the simplest (Poisson) stream of requirements with the parameter?. If at the moment of receipt of the next demand in the system there are already at least n requirements (that is, all channels are occupied), then this requirement becomes a queue and waits for the start of service.
The servicing time of each requirement tob is a random variable that obeys the exponential distribution law with parameter?.
A commercial bank is an example of an open-ended queuing system in which the incoming flow of customer requirements is unlimited. To assess and optimize the quality of service in a commercial bank, you can use the analytical method of queuing theory.
This method of the theory of queuing allows you to establish the relationship between the given conditions of the bank (the number of specialists, their productivity, work rules, nature of the customer flow) and the characteristics of interest - QS performance indicators that describe, from one point of view or another, its ability to cope with the customer flow (average the number of clients serviced by a specialist per unit time; average number of specialists engaged in servicing; average queue length and average waiting time for each client ntom start service, etc.).
In this regard, the purpose of assessing the functioning of the bank is to establish the relationship between customer flows, the number of specialists, the performance of an individual specialist and the effectiveness of services to identify areas for improving the quality of customer service.
Consider the algorithm for calculating some indicators of the quality of service of a commercial bank as an open queuing system with expectation.
When studying such systems, various indicators of the efficiency of the service system are calculated. The main indicators can be the probability that all channels are free or busy, the mathematical expectation of the queue length (average queue length), the coefficients of employment and downtime of service channels, etc.
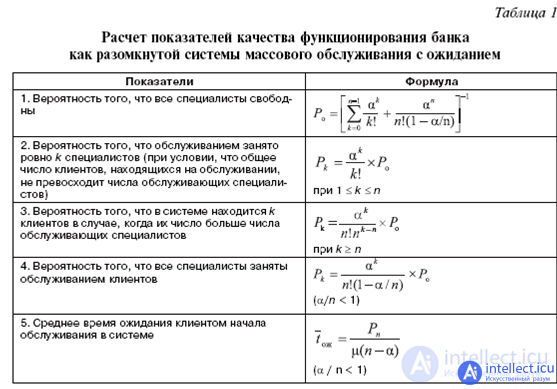
We introduce the parameter? =? /?. If ? / n <1, then the queue cannot grow indefinitely. This condition has the following meaning:? - The average number of customers arriving per unit of time; 1 / ? - average service time by one specialist of one client, then? =? * 1 /? - the average number of specialists that you must have in order to serve all incoming customers per unit time. Therefore, the condition? / n <1 means that the number of service specialists should be greater than the average number of specialists required to serve all incoming clients per unit of time.
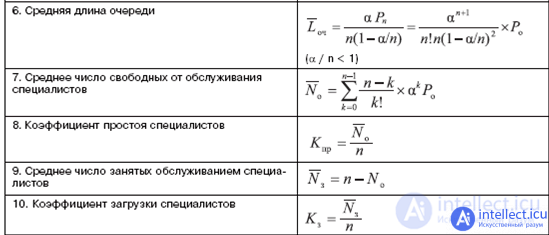
The set of performance indicators of the functioning of a commercial bank as an open queuing system with expectation is presented in table. 1.
Consider the application of the analytical method of the theory of queuing on the example of the activities of four branches of a commercial bank.
To determine the performance indicators of bank branches, the initial data were identified, identified during the monitoring of customer service during the month, calculated as the arithmetic average of the values received for each day of the month. A unit of time is one hour of a working day.
Bank branch number 1:
Bank branch number 2:
Bank branch number 3:
Bank branch number 4:
Was the parameter introduced into consideration? =? /? - the average number of specialists that you must have in the bank’s operational office in order to service all incoming customer requirements per unit of time.
Bank branch number 1:? = 124/14 = 8.9.
Bank branch number 2:? = 55/10 = 5.5.
Bank branch number 3:? = 70/11 = 6.4.
Bank branch number 4:? = 94/13 = 7.2.
Since in all cases? / N <1, the queue cannot grow indefinitely.
The following performance indicators were determined for the functioning of the branches of a commercial bank (Table 2).
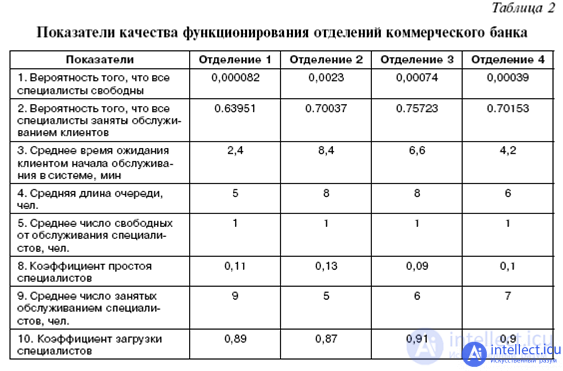
The data in the table shows that in department No. 1 only 64% of the time, specialists are fully engaged in customer service, and in departments No. 2, 3 and 4 - 70; 75.7; 70.2% of the time, respectively.
The smallest average time a client waits for a service to start in branch No. 1 is 0.04 hours (2.4 minutes); the waiting time in department No. 4 is slightly longer — 0.07 hours (4.2 minutes). Quite high values in departments No. 3 and 2 - 0.11 hours (6.6 minutes) and 0.14 hours (8.4 minutes), respectively. Thus, the largest average queue length is observed in departments No. 2 and 3, the queue in department No. 4 is slightly shorter, the minimum average queue length in department No. 1.
In all the bank's offices, on average, one specialist is not engaged in customer service for an hour.
The values obtained downtime coefficients are relatively low in all departments.
In general, the values of the obtained load factors are quite high and practically do not differ according to the bank's operational offices.
Despite the fact that the values of such indicators as the likelihood that all specialists are engaged in customer service; average number of service-free specialists; the idle rate of specialists; the load factor of specialists practically does not differ by department, nevertheless, the most rationally organized work is customer service in department No. 1, in which the distribution of client flows in the operating room is better regulated, therefore, the quality of service is higher.
The application of the analytical method of the theory of queuing confirms the existence of a close relationship between customer flows, the number and productivity of bank specialists and the effectiveness of customer service for banking services.
Thus, using the methods of the theory of mass service, many tasks of planning, evaluating and optimizing the quality of customer service in a commercial bank can be solved, in particular, recommendations can be developed on the rational construction of the bank's servicing systems, the organization of their work and the regulation of the flow of applications at minimal costs with downtime of service channels, in order to ensure the competitiveness and high efficiency of the commercial bank.

Comments
To leave a comment
Queuing theory
Terms: Queuing theory