Content
Introduction
An example of using various window functions for spectral analysis of the final signal
The rule of choosing the window function to ensure the dynamic range of the spectral analysis
Window function selection rule for frequency resolution
findings
Introduction
In this article we will give an example of using window functions in digital spectral analysis. To do this, we will simulate several signals and analyze their spectrum calculated without window smoothing and using some windows.
An example of using various window functions for spectral analysis of the final signal
Consider the first example. Let the signal consist of three harmonics:
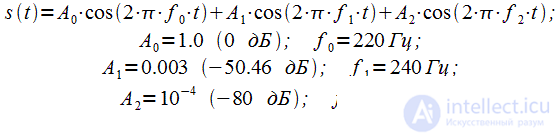 |
(one) |
The dynamic range of this signal, which can be defined as the ratio of the maximum amplitude of the harmonic to the minimum is 80 dB. The sampling rate is equal to

, the sample is equal to

signal readings. The distance between the spectral samples:
 |
(2) |
Calculate the spectrum of this signal using a rectangular window, Hemmign window, Blackman window and Blackman-Nattal window. Figures 1-4 show the results of spectral analysis using different windows. The true harmonics of the signal (1) are shown in blue.
|
Figure 1: Signal spectrum when using a rectangular window (without anti-aliasing)
|
Figure 2: Signal spectrum when using Hamming window
|
|
Figure 3: Signal spectrum when using the Blackman window
|
Figure 4: Signal spectrum when using the Blackman-Nattala window
|
Let's analyze the results. Without window smoothing, due to the very high level of side lobes of the spectrum of a rectangular window (-13 dB), only harmonics at a frequency of 220 Hz are detected in the spectrum. The remaining harmonics at frequencies of 230 Hz and 240 Hz are hidden by the side lobes of the spectrum of a rectangular window. When using the Hamming window, the side-lobe level of which is -42 dB, we can clearly see the harmonic at a frequency of 220 Hz, and also weakly noticeable components at a frequency of 240 Hz. The signal at a frequency of 240 Hz is lower than the side lobes of the spectrum of the Hamming window, so it is very weakly visible. The side lobe level of the Blackman window (-58 dB) is lower than the harmonic amplitude at a frequency of 240 Hz (-50.46 dB), so using the Blackman window will make it possible to detect components at frequencies of 220 Hz and 240 Hz. However, the level of side lobes of the Blackman window is higher than the amplitude of the signal at a frequency of 230 Hz (-80 dB), so the use of the Blackman window does not allow detecting a signal at a frequency of 230 Hz. Finally, the Blackman-Nattala window, whose spectrum has a side-lobe level of -98 dB, allows all spectral components to be detected.
The rule of choosing the window function to ensure the dynamic range of the spectral analysis
You can formulate a rule. In the spectral analysis of a signal with a known or specified dynamic range, it is necessary to select such a window function, the level of the side lobes of the spectrum of which is less than the specified dynamic range. Otherwise, some spectral components of the signal may not be detected. For example, if the dynamic range of the signal does not exceed 40 dB, it is advisable to use the Hamming window, the side lobes of the spectrum of which do not exceed -42 dB. If the dynamic range of the signal does not exceed 60 dB, then the Blackman window can be used (the level of the side lobes of the spectrum is -58 dB).
If the dynamic range of the signal is not known, then it can be estimated based on the ADC bit width using the formula:
 |
(3) |
Where

- dynamic range in decibels,

- The number of bits of the ADC. In the case of an 8-bit ADC, the dynamic range of the signal can be considered equal to 48.16 dB, and in the case of a 16-bit ADB, 96.32 dB. You can also a priori estimate the dynamic range based on the type of signal being processed. For example, the dynamic range of an audio signal does not exceed 40 dB and you can use the Hamming window even with 16-bit quantization in the spectral analysis of audio signals.
In the above example, the harmonics of the signal are separated from each other by 10 Hz. At the same time, the use of window smoothing leads to a deterioration of the frequency resolution due to the expansion of the main lobe of the spectrum of the window function (this is described in detail here). In our case, the width of the main lobe of the spectrum of the Blackman-Nattala window is
 |
(four) |
Where

- the normalized width of the main lobe of the spectrum of the Blackman-Nattala window at the zero level (a dimensionless quantity), taken from the table of properties of window functions. In this case, it is important that

less than the distance between the frequencies of the spectral components of the signal (10 Hz). Thus, the use of window functions degrades the resolution of spectral analysis. If the frequency resolution is set

which requires analyzing the spectrum of the signal, it is necessary to fulfill the condition

or
 . . |
(five) |
In view of (2)
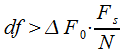 |
(6) |
Window function selection rule for frequency resolution
At a given window, which is selected based on the dynamic range of the signal,

To ensure the required frequency resolution, condition (6) must be met. With a fixed sampling rate

to increase the frequency resolution, it is necessary to increase the sample length

. For example, you need to provide frequency resolution

sampling frequency

Smoothing is performed using the Blackman-Nattala window.
. Then from (6) we get:
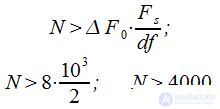 |
(7) |
Those. FFT sample size should be 4096 points.
Consider the second example. Let the signal consist of three harmonics:
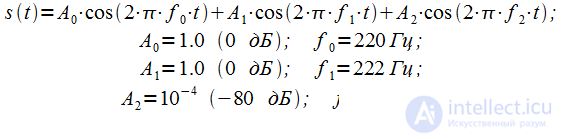 |
(eight) |
The dynamic range of the signal is 80 dB, so you need to use the Blackman-Nattal window. The sampling rate is set equal to
frequency resolution required

, since the zero and first harmonics of the signal (8) are separated by
. According to (7), the FFT sample size should be

points. Figures 5 and 6 show the signal spectra when using the Blackman-Nattala window and different FFT sample sizes. The true harmonics of the signal (8) are shown in blue.
Figure 5: Signal spectrum when using the Blackman-Nattala window, |
Figure 6: Signal spectrum when using the Blackman-Nattala window,  |
Comparing Figures 5 and 6, you can see that the window satisfies the dynamic range of the signal and the harmonic at a frequency of 240 Hz is detected in both spectra. However, when
the frequency resolution does not allow separation of harmonics at frequencies of 220 and 222 Hz, since condition (6) is not satisfied. With
condition (6) is satisfied and all three harmonics are distinguishable in the spectrum (Figure 6).
findings
So let's summarize. For the qualitative spectral analysis it is necessary:
1. It is correct to choose the window function based on the dynamic range of the signal, so that the level of side lobes of the spectrum of the window function is less than the dynamic range of the signal.
2. Select the FFT sample size to provide the required frequency resolution according to (6) based on the sampling frequency and properties of the selected window function.
Thus, the article provides examples of spectral analysis of signals using window functions, as well as practical recommendations on the choice of window functions and the size of the FFT sample.

Comments
To leave a comment
Digital signal processing
Terms: Digital signal processing