Lecture
Today we return to the most interesting topic, namely, the discussion of neural networks .
And today we will talk about another type of network called the Kohonen network , which are also called Kohonen maps. We have to figure out what the principle of their work is, what goals they are intended to realize, in general, we are interested in everything today regarding the Kohonen neural networks.
So, let's start by discussing what tasks the Kohonen neural networks should perform. Their main purpose is the clustering of samples, that is, the separation of samples into groups (clusters) according to certain signs. For example, we may face the task of classifying athletes by the sport in which they are engaged. Here, suitable signs can be height, weight, time during which the athlete runs a hundred meters, etc. =) If you skip the “parameters” of all athletes through the Kohonen network, then we will receive a certain number of groups at the output, and the following conditions must be met:
In this example, all athletes involved in athletics will fall into one group, and basketball players into another. With further training of the network, a group of runners can separate from the group of athletes. And then, following the second of the listed properties, the group of runners should be located close to the group of athletes and far from the group of basketball players. This is how the networks of this type work in general.
The neural network of Kohonen, in contrast to the networks we studied earlier, is trained without a teacher and is called the self-organizing Kohonen map ( SOFM - Self-Organizing Feature Map ). Let's take a closer look at its structure.
Kohonen maps have a set of input elements, the number of which coincides with the dimension of the vectors supplied to the input, and a set of output elements, each of which corresponds to one cluster (group). If we analyze athletes on 4 grounds - running speed, height, weight, endurance, then, accordingly, we should have 4 entries, one for each attribute. In this case, one of the athletes acts as an input vector, and its coordinates are the values of its attributes. I do not know if I have chosen the successful analogy, but I hope that with such examples it will become clearer the essence of the work of Kohonen self-organizing maps )

Usually try to set the number of output elements less than the number of input, in this case, the network allows you to get a simplified characteristic of objects for further work with them.
It is also necessary to stop on the structure of connections between network elements. Everything is simple - every input element is connected with every weekend, and all connections, as well as for other neural networks, have a certain weight, which is adjusted in the learning process.
But before proceeding to discuss the subtleties of learning Kohonen networks , let's see how the network should work in general ...
When applying a vector to the input, the network must determine which of the clusters this vector is closest to. As the proximity criterion, the minimality criterion of the square of the Euclidean distance can be chosen. Consider the input vector as a point in the n-dimensional space (n is the number of coordinates of the vector, this number is equal to the number of input neurons, as we discussed earlier). Then we need to calculate the distance between this point and the centers of different clusters and determine the distance to which of the clusters will be minimal. Then this cluster (and the corresponding output neuron) is declared the winner.
And which point is the center of the cluster and what are its coordinates in this space? Everything is very elegant here =) The coordinates of the cluster center are the weights of all the connections that come to this output neuron from the input elements. Since each output neuron (cluster) is connected to each input neuron, we get n connections, that is, n coordinates for the point corresponding to the center of the cluster. The formula for calculating the square of the Euclidean distance is as follows:

Here  - squared distance between point P and cluster K. Point P coordinates -
  , and the coordinates of the center of the cluster K -
  .
.
Thus, by submitting a vector to the input of the network, we get one cluster-winner, respectively, this vector will belong to this cluster (group). This is exactly how Kohonen maps solve the problem of classification.
Let's now move on to the learning process, because before the network begins to properly group the elements into clusters, it is necessary to train it.
The essence of learning is as follows. At the entrance is a vector from the training sample. For this vector, the winning cluster is determined, and for this cluster, the weights are corrected so that it is even closer to the input vector. Most often, the weights of several neighbors of the winning cluster are also adjusted.
Unlike learning with a teacher, discussed earlier, the essence of learning is not to compare the output of the network with the ideal output, but to adjust the weights of all connections for maximum coincidence with the input data.
To adjust the weights, use the following formula:

In this formula  - weight at step t + 1, and
  - weight at step t (that is, at the previous one).
  - learning rate, and
  - coordinate of the input vector. Please note that the learning rate also depends on the step number and changes during the learning process. In addition, the radius that determines how many network elements will be subjected to the adjustment of the weights changes. Let's take a closer look at what determines this radius.
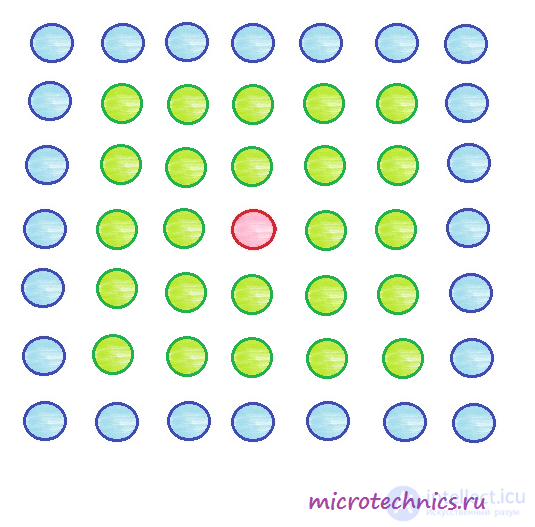
Output (cluster) elements of the Kohonen network are usually located in one way or another in two-dimensional space. Let's place, for example, the output elements in the form of a square grid and set the initial learning radius to 2. Feed the vector to the network input and the neuron turns out to be the winner, marked in red in the diagram. According to the learning algorithm, we must update the weights for this neuron, as well as for those that fall within a circle of a given radius (in this case 2) - these elements are highlighted in green.
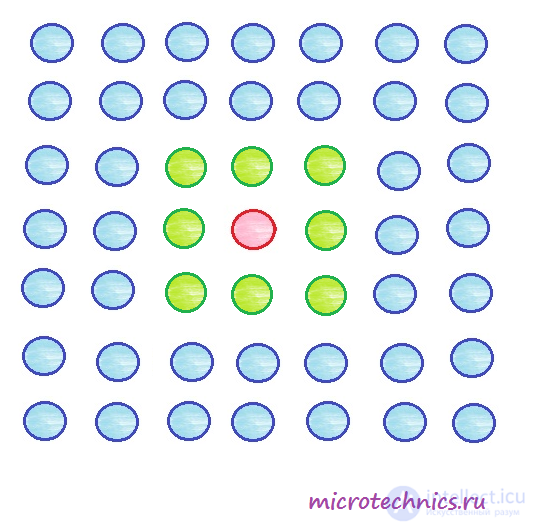
Toward the end of the learning process, the radius is reduced. Let it become equal to one, then the weights of the following elements will be updated:
So, having analyzed all the components of the learning process, let's write a specific algorithm for this process:
Learning stops when weights become very small.
At this moment I propose to stop today, since the article turned out to be quite large) We will definitely continue to study the maps of Kohonen in the next article!
We continue to work with Kohonen self-organizing maps , but rather continue to study the principles of their functioning and training.
So let's get down to business ...
We finished the first part by examining the Kohonen network learning algorithm . Let's look at a small example that demonstrates the flow of this process.
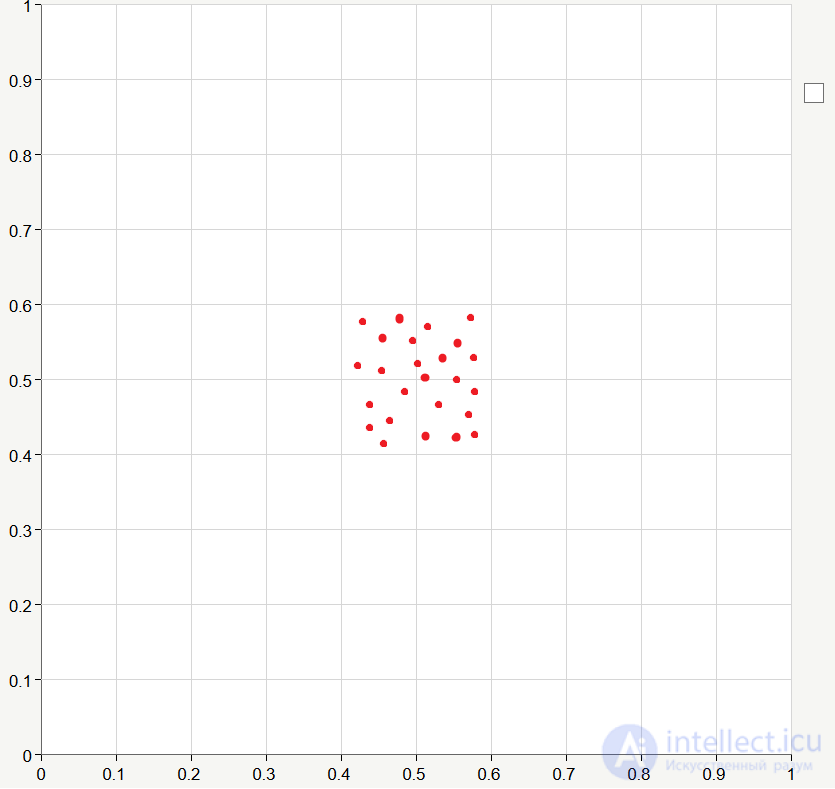
Consider a network that has 2 input elements and 25 output.

For each cluster, we set the bond weights equal to some values close to 0.5 . As we discussed in the previous article, the weight values are the coordinates of the clusters, and since in this case we have two coordinates, that is, two-dimensional space, we can easily depict all the clusters on the graph:
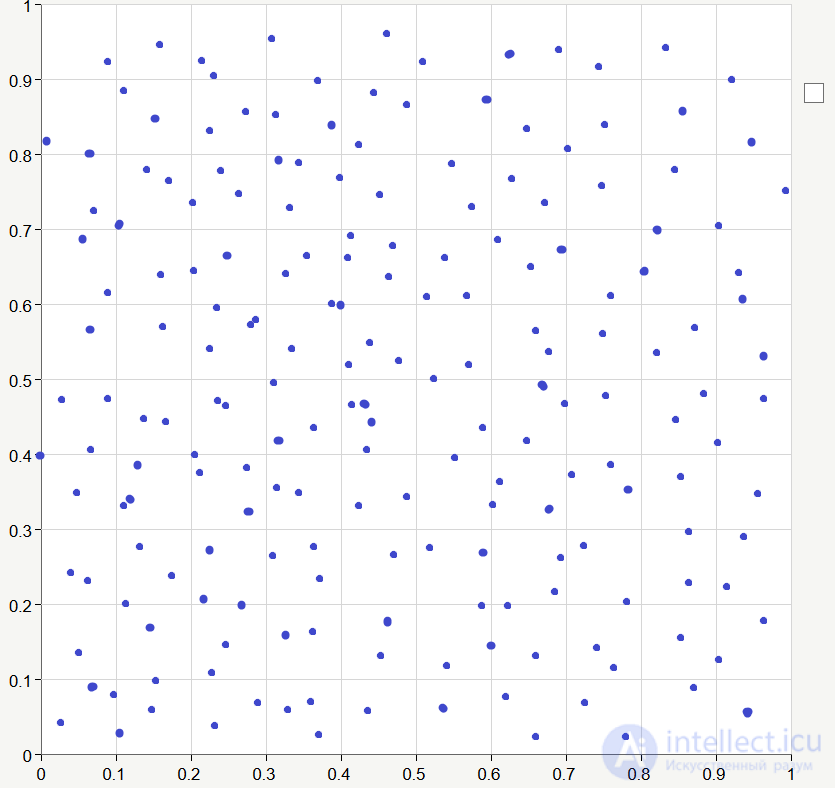
Let the training data be generated randomly in the range from 0 to 1 :
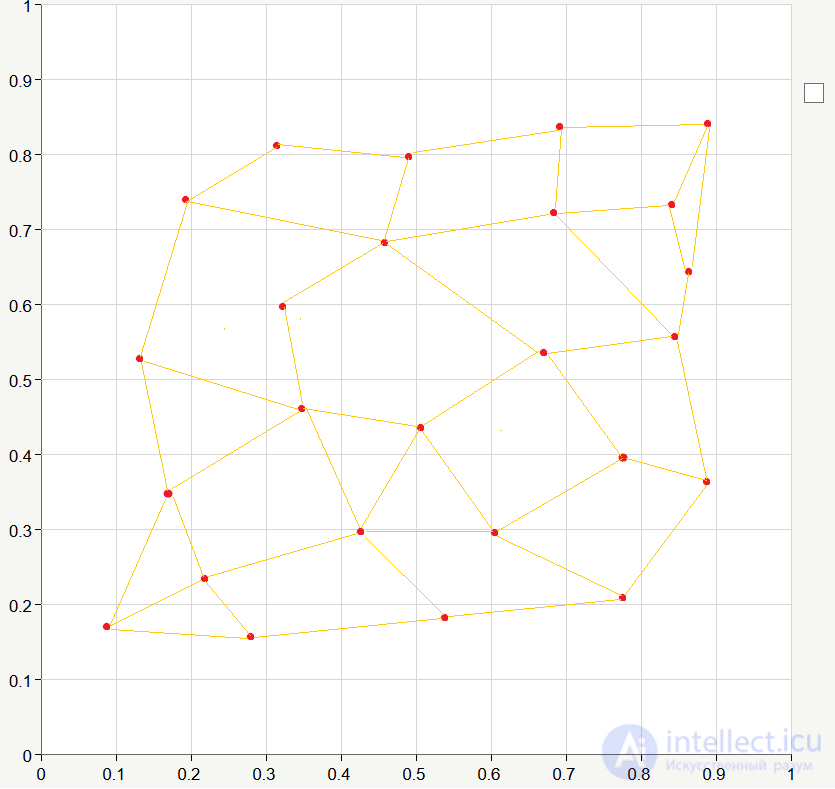
So, we have a network, there are initial values of the coupling coefficients, there is a training sequence, so let's conduct the training =) Unlike training with a teacher, when training the Kohonen network, a training sample is fed to the input not once, but many times. One complete pass of the training set is called the era . This is how our network might look like after 20-30 epochs of learning (I connected neighboring clusters with lines):
As you can see the network is "stretched." We will continue training, and after 200 epochs the network may take the following form:
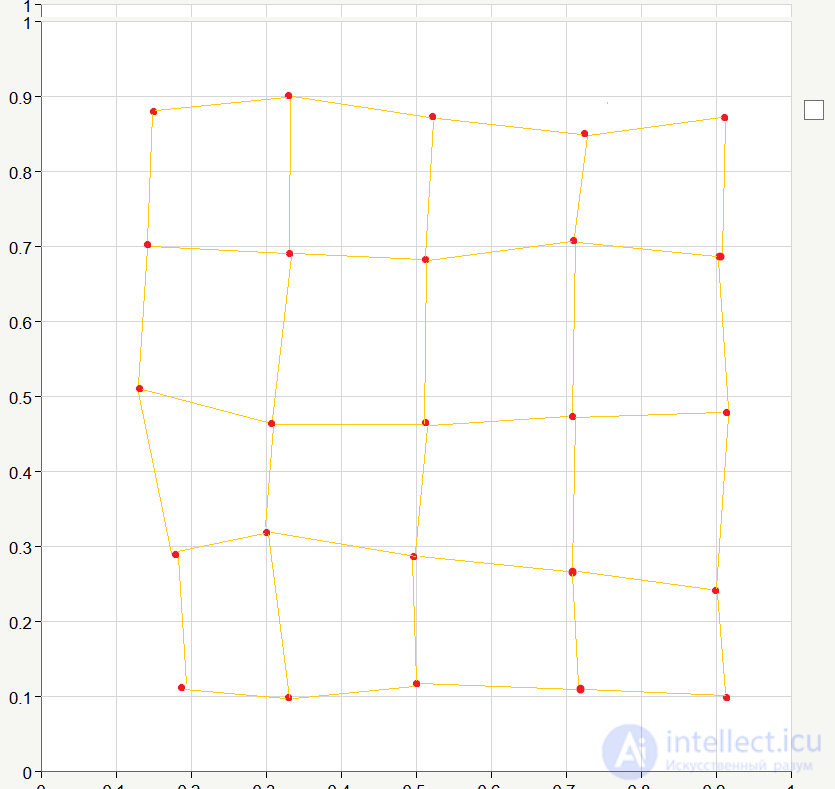
As a result, we get a rather ordered arrangement of neurons. This is due to the fact that we took the input elements randomly and they are more or less evenly distributed in the square corresponding to the coordinates from 0 to 1. Naturally, in practice we would hardly get such an ideal option, but this example describes the essence of the learning process very well) In order to achieve "ideality" in real learning, it is necessary to very successfully select the initial weights of the links, which we in our theoretical example set at random.
In fact, the considered network is not very suitable for solving real-world problems, since in most cases when using Kohonen maps, they tend to get a simpler characteristic of the data than the original one. That is, the number of output elements is chosen smaller than the number of input features.
There are special programs that allow you to simulate neural networks, in particular the Kohonen network. If you wish, you can write your own program for solving similar tasks and graphically displaying the results. I found a less vivid example of the work of such a program on the Internet and I want to give here so that you can get an idea of how it all works and is used in practice.
Suppose we have a network that accepts 20 signs at the input, and the output neurons are a 12 * 16 network, as in this figure: 
The left part of the image is the input map for one of the signs. Yellow and red colors correspond to the maximum values of the attribute, and blue - the minimum. Based on the picture, we can conclude that the input elements that have the values of the test feature close to the maximum will be assigned to clusters located in the upper right corner.
Such input cards can be constructed for any of the 20 input features.
The right side of the picture is the output map, that is, our network has determined that the initial clusters (12 * 16 pieces) can be combined as indicated in the image. That is, in the end, we get 7 different groups to which the input elements can be assigned. Perhaps, at first glance, all this seems rather incomprehensible, and perhaps meaningless, but in fact all this is very logical and beautiful =)
On this note we finish today's article, I hope that I managed to reveal the theme of Kohonen's self-organizing maps , so see you soon!

Comments
To leave a comment
Computational Intelligence
Terms: Computational Intelligence