Lecture
Qt Creator does not contain a debugger. It provides a debugger plugin that acts as an interface between the Qt Creator core and external debuggers, such as the GNU Symbolic Debugger (gdb), Microsoft Console Debugger (CDB), and the internal Java Script debugger. You can use these debuggers to debug C ++.
Use the Debug mode in Qt Creator to view the status of your Qt projects while debugging.
In Debug mode, you can interact with the debugger in various ways, including the following:
Qt Creator displays raw information provided by debuggers in an explicit and concise way in order to simplify the debugging process as much as possible without limiting the debugger capabilities.
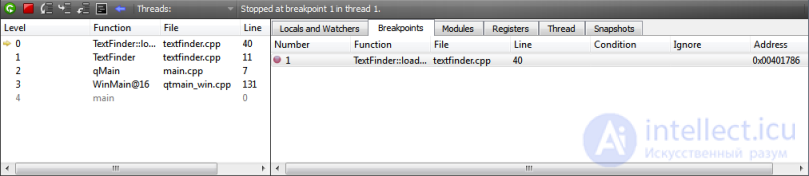
In addition to the basic IDE functionality provided by viewing the stack, viewing local and monitored variables, registers, and so on, Qt Creator has additional features, making debugging of Qt-based applications easier. The debugger plugin is aware of the internal structure of some Qt classes, such as QString, Qt containers and, most importantly, QObject (and classes inherited from it), as well as most C ++ Standard Library containers and some gcc and Symbian extensions. Understanding their device is used to present the contents of such classes in a convenient way.
For an example of how to debug applications in Debug mode, see Debugging a Sample Application.
For more information about the features available in Debug mode, see Interacting with a Debugger.
If you installed Qt Creator as part of the Qt SDK, the GNU Symbolic Debugger was installed automatically and should be ready to start debugging after creating a new project. If you want a specific setting, such as using debugging tools for Windows, see Setting Up a Debugger.
The debugger plugin works in different modes depending on where and how the process is started and executed. Some modes are available only for certain operating systems or platforms.
You can run the debugger in the following modes:
When you click the Start Debugging button, the debugger runs in the appropriate mode (idle, terminal or TRK), depending on the build and launch settings for the active project. To launch the debugger in other modes, use the Debug menu items.
To start the debugger in simple mode, click the Start Debugging button for the active project or select Debug> Start Debugging> Start External Debugging Application ... and specify the executable file.
To start the debugger in terminal mode, select Projects> Startup Settings and enable the Run in terminal check box. Then click the Start Debugging button for the active project.
To start the application in connection mode, select Debug> Start Debugging> Connect to a Running External Application ... , and then select the process to connect by name or its ID.
Remote mode uses the gdbserver daemon running on the remote machine.
To run the debugger in remote mode, select Debug> Start Debug> Start and Connect to Remote Application ....
Kernel mode is only available in Unix. It debugs crashing processes using kernel files (crash dumps) that are generated if this option is enabled.
To enable saving of kernel files, enter the following command at the command prompt where the application will be launched:
ulimit -c unlimited
To launch the debugger in kernel mode, select Debug> Start Debug> Connect to Dump ....
Post-mortem mode is available only on Windows where debugging tools for Windows are installed.
The Qt Creator installation program asks if you want to register the Qt Creator as a post-mortem debugger. To change this setting, select Tools> Options ...> Debugger> General> Use Creator for post-mortem debugging .
You can run the debugger in post-mortem mode if the application crashes in Windows. Click the Debug in Qt Creator button in the error message displayed by the Windows operating system.
TRK mode is a special mode available only for Symbian. It debugs processes running on a Symbian device using the App TRK application running on the device.
To start the debugger in TRK mode, open the project, select Symbian as the target, and click the Start Debugging button.

Comments
To leave a comment
Cross platform programming
Terms: Cross platform programming