Lecture
Lecture questions:
1. Qualification assessment method
2. Calculation of single and generalized indicators of properties
3. Quality log
4. The calculation of the final indicator
Differential method for assessing product quality
carried out by comparing the indicators of individual
properties of the evaluated sample with the corresponding indicators
mi base sample. At the same time, it is determined by how many
quality of the evaluated product to the quality of the base sample
in general, and what indicators of the properties of the product being evaluated are pre-
ascend or do not correspond to the base sample,
and how similar are similar to each other
properties
In the differential method of quality assessment,
are the most significant properties of the object and are conventionally considered
as equivalent. The number of such properties taken into account
that facilitates the process of assessing the quality level
delivered objects.
Differential quality assessment method is first
queue qualification method that allows you to evaluate
for example, technical products for such quality categories,
as “superior”, “compliant” or “non-compliant”
a certain (for example, world-wide) quality level of a similar
products. At the same time, with the differential method
ki product quality quantified individual
product properties that allow you to make specific decisions
on the quality management of this product.
2. Calculation of single and generalized
property indicators
In the differential method of assessing product quality
calculate levels of single and / or generalized indicators
properties according to the formulas:
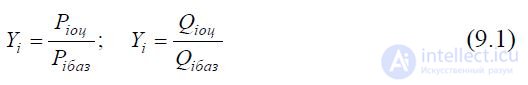
or
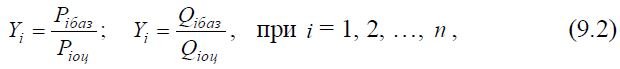
, with i = 1, 2, ..., n ,
where Piоts and Qiоts are the values of the i -th single and generalized indicator of the properties of the product being evaluated;
Pibaz and Qi bases - the values of the i- th indicator of the base sample;
n is the number of relevant indicators adopted for quality assessment.
Formula (9.1) is used when the increase in the absolute
lute value of the quality indicator corresponds to the improvement
quality products. So, for example, the relative performance indicators are
performance, power, efficiency,
service life is calculated by the formula according to this formula, since
an increase in their values indicates an improvement in product quality.
In other cases, when increasing the absolute value
property indicator characterizes deterioration in the quality of products
tion, then to calculate the relative value of the indicator
use the formula (9.2). According to this formula is usually calculated from
the relative values of indicators such as material consumption;
consumption of materials, fuel, energy; the content of harmful substances
this waste, labor intensity; bounce flow parameters, etc.
Formulas (9.1) and (9.2) are valid subject to the absence
restrictions in the values of individual indicators of quality. With
the presence of such restrictions values of relative indicators
calculate with these restrictions to the limit values of Pp
In this case, for example, the first of formulas (9.1) transforms
to the form:
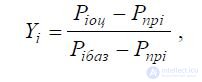
where Ppr i is the limiting value of the i -th parameter.
According to the results of calculations of relative values
the properties of the compared products and their analysis give the following
unconditional estimates:
- the level of product quality is higher or equal to the level of
base sample if all values of relative indicators
respectively, greater than or equal to one;
- the quality level of the product being evaluated is below the level
The base sample, if all or most of the values are from
personal indicators less than one.
For example, given the indicators of the basic properties of the tractor T and
two basic tractors (tab. 7).
Table 7 Indicators of the properties of tractors and their numerical value
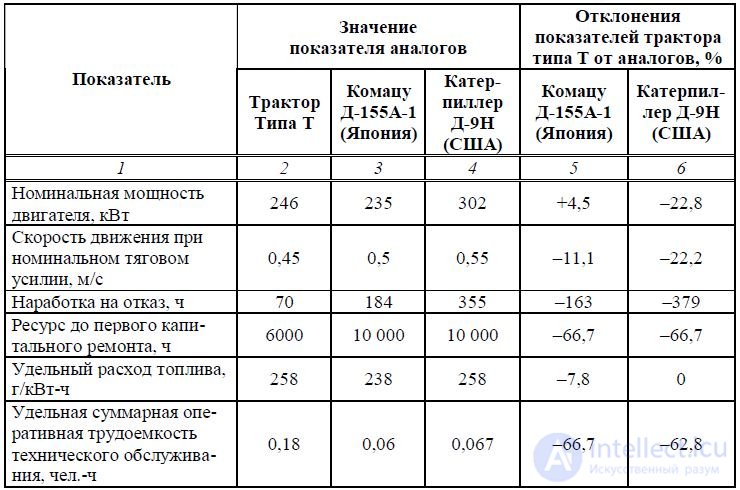
Note. The sign "+" means the deviation of the indicator for the better,
the sign "-" means worse
Qualification assessment of the technical level of the tractor T
produced by the six parameters of three groups: destination (but
mine power and speed), reliability (in
rework on failure and resource before the first overhaul), eco-
resource names
(specific fuel consumption and labor intensity
Maintenance). From the table it can be seen that
tractor T surpasses one analog only in engine power
For, and all other indicators are inferior to both peers. Conclusion:
tractor type T is inferior (does not correspond) to the world level.
The technical level of the evaluated products, for example,
tire construction, for which the importance of each
This indicator is recognized below the TU of the baseline
sample, if at least one of the relative indicators is less than
above units.
In cases where part of the relative indicators
properties is greater than or equal to one, and the other part is less than one
nits, i.e. when there is some uncertainty in the assessment
product quality, it is recommended to use the following
evaluation method. All relative indicators needed
properties divided by significance into two groups. In the first (o
new group should include indicators characterizing
the most significant properties, and in the second - minor.
If it turns out that in the first group all relative indicators
whether it is greater than or equal to one, then we can assume that the quality
estimated product is not worse than the quality of the base sample.
For a more accurate and more informative assessment of the specification,
characterizing the quality of the product, build a chart comparing
quality indicators (cyclogram), which clearly
shows which indicator should be used for management
and technical solutions.
In fig. 8 in a simplified form is shown the cyclogram of a certain
dividing the technical level in terms of quality
basic and basic products using eight basic
properties presented on eight qualimetric scales
lah.
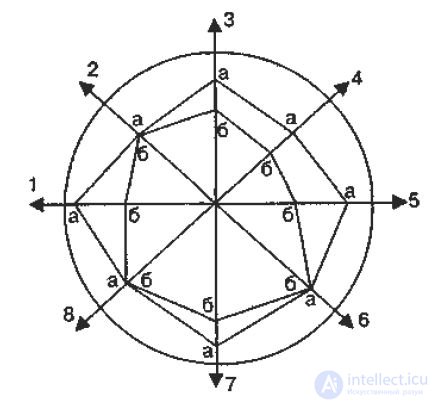
Fig. 8. The sequence diagram for determining the quality of products:
1 - performance; 2 - specific gravity; 3 - coefficient
automation; 4 - reliability; 5 - annual yield;
6 - specific occupied area; 7 - aesthetic indicators;
8 - specific installed electric power
The scales lay the values of the indicators estimated
product (point b) and analogue (point a). Points connect between
and get two polygons. Polygon forming
points “a”, characterizes the set of properties of the analogue
hectare or base sample, and the polygon formed by the dots
b, is the set of properties of the product being evaluated.
From the cyclogram ("web of quality") it is clear that the area
occupied by the polygon properties of the product being evaluated,
less than the area occupied by the polygon properties of the analog.
This suggests that TU and, therefore, quality
the set of properties is inferior to the level of analog, non-
despite the fact that the values of individual indicators of the product
(specific weight, occupied area, installed electrical
power) equal to the values of these indicators analog. OK-
The strength on the cyclogram characterizes the ideal quality, i.e.
quality that can be achieved. On the axes (scales)
standing from the center to the circle corresponds to the limit
value of the parameter - property indicator.
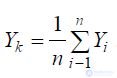
Quantitatively, the value of the final quality indicator,
those. quality level (Yk), can be calculated as a definition
arithmetic mean value of all levels considered
properties (Yi), matched (estimated and base) samples (objects), that is, as
For example, in engineering to determine the TU machines and
devices use a number of indicators that are usually divided
on the main and additional.
The main indicators of quality include indicators designated
maintenance or operational, reliability, economical
use of raw materials, materials, fuel, energy, ergonomic
and aesthetic, indicators of manufacturability, transport
simplicity, standardization and unification.
Additional indicators usually include patent
legal and some others.
If the distribution of relative indicators of properties
other and more complex, the technical level assessment is necessary
implement using integrated or mixed methods.

Comments
To leave a comment
Qualimetry reliability and quality
Terms: Qualimetry reliability and quality